Building Airbnb Categories with ML & Human in the Loop
Airbnb Categories Blog Series — Part II : ML Categorization
By: Mihajlo Grbovic, Pei Xiong, Pratiksha Kadam, Ying Xiao, Aaron Yin, Weiping Peng, Shukun Yang, Chen Qian, Haowei Zhang, Sebastien Dubois, Nate Ney, James Furnary, Mark Giangreco, Nate Rosenthal, Cole Baker, Bill Ulammandakh, Shankar Shetty, Sid Reddy, Egor Pakhomov

Airbnb 2022 release introduced Categories, a browse focused product that allows the user to seek inspiration by browsing collections of homes revolving around a common theme, such as Lakefront, Countryside, Golf, Desert, National Parks, Surfing, etc. In Part I of our Categories Blog Series we covered the high level approach to creating Categories and showcasing them in the product. In this Part II we will describe the ML Categorization work in more detail.
Throughout the post we use the Lakefront category as a running example to showcase the ML-powered category development process. Similar process was applied for other categories, with category specific nuances. For example, some categories rely more on points of interests, while others more on structured listing signals, image data, etc.
Category Definition
Category development starts with a product-driven category definition: “Lakefront category should include listings that are less than 100 meters from the lake”. While this may sound like an easy task at first, it is very delicate and complex as it involves leveraging multiple structured and unstructured listing attributes, points of interest (POIs), etc. It also involves training ML models that combine them, since none of the signals captures the entire space of possible candidates on their own.
Listing Understanding Signals
As part of various past projects multiple teams at Airbnb spent time on processing different types of raw data to extract useful information in structured form. Our goal was to leverage these signals for cold-start rule-based category candidate generation and later use them as features of the ML model that could find category candidates with higher precision:
- Host provided listing information, such as property type (e.g. castle, houseboat), amenities & attributes (pool, fire pit, forest view, etc.). listing location, title, description, image captions that can be scanned for keywords (we gathered exhaustive sets of keywords in different languages per category).
- Host guidebooks, where hosts recommend nearby places for guests to visit (e.g. a Vineyard, Surf beach, Golf course) which hold locations data that was useful for extracting POIs
- Airbnb experiences, such as Surfing, Golfing, Scuba, etc. Locations of these activities proved useful in identifying listing candidates for certain activity-related categories.
- Guest reviews which is another source that can be scanned for keywords. We also collect supplemental guest reviews where guests provide feedback on listings quality, amenities and attributes.
- Wishlists that guests create when browsing, such as “Golf trip 2022”, “Beachfront”, “Yosemite trip”, are often related to one of the categories, which proved useful for candidate generation.

Figure 1. Popular wishlists created by airbnb users
The listing understanding knowledge base was further enriched using external data, such as Satellite data (tell us if a listing is close to an ocean, river or lake), Climate, Geospatial data, Population data (tells us if listing is in rural, urban or metropolitan area) and POI data that contains names and locations of places of interest from host guidebooks or collected by us via open source datasets and further improved, enriched and adjusted by in-house human review.
Finally, we leveraged our in-house ML models for additional knowledge extraction from raw listing data. These included ML models for Detecting amenities and objects in listing images, Categorizing room types and outdoor spaces in listing images,, Computing embedding similarities between listings and Assessing property aesthetics. Each of these were useful in different stages of category development, candidate generation, expansion and quality prediction, respectively.
Rule-based candidate generation
Once a category is defined, we first leverage pre-computed listing understanding signals and ML model outputs described in the previous section to codify the definition with a set of rules. Our candidate generation engine then applies them to produce a set of rule-based candidates and prioritizes them for human review based on a category confidence score.
This confidence score is computed based on how many signals qualified the listing to the category and the weights associated with each rule. For example, considering Lakefront category, vicinity to a Lake POIs carried the most weight, host provided signals on direct lake access were next more important, lakefront keywords found in listing title, description, wishlists, reviews carried less weight, while lake and water detection in listing images carried the least weight. A listing that would have all these attributes would have a very high confidence score, while a listing that would have only one would have a lower score.
Human review process
Candidates were sent for human review daily, by selecting a certain number of listings from each category with the highest category confidence score. Human agents then judged if listing belongs to the category, choose the best cover photo and assessed the quality of the listing (Figure 3)
As human reviews started rolling in and there were enough listings with confirmed and rejected category tags it unlocked new candidate generation techniques that started contributing their own candidates:
- Proximity based: leveraging distance to the confirmed listing in a given category, e.g. neighbor of a confirmed Lakefront listing it may also be Lakefront
- Embedding similarity: leveraging listing embeddings to find listings that are most similar to confirmed listing in a given category.
- Training ML categorization models: once the agents reviewed 20% of rule-based candidates we started training ML models.
In the beginning, only agent vetted listings were sent to production and featured on the homepage. Over time, as our candidate generation techniques produced more candidates and the feedback loop repeated, it allowed us to train better and better ML models with more labeled data. Finally, at some point, when ML models were good enough, we started sending listings with high enough model scores to production (Figure 2).

Figure 2. Number of listings in production per category and fractions vetted by humans
Aligning ML Models with Human review tasks
In order to scale the review process we trained ML models that mimic each of the three human agent tasks (Figure 3). In the following sections we will demonstrate the training and evaluation process involved with each model

Figure 3. ML models setup for mimicking human review
ML Categorization Model
ML Categorization Model task was to confidently place listings in a category. These models were trained using Bighead (Airbnb’s ML platform) as XGBoost binary per category classification models. They used agent category assignments as labels and signals described in the Listing Understanding section as features. As opposed to a rule-based setting, ML models allowed us to have better control of the precision of candidates via model score threshold.
Although many features are shared across categories and one could train a single multiclass model, due to the high imbalance in category sizes and dominance of category-specific features we found it better to train dedicated ML per category models. Another big reason for this was that a major change to a single category, such as change in definition, large addition of new POIs or labels, did not require us to retrain, launch and measure impact on all the categories, but instead conveniently work on a single category in isolation.
Lakefront ML model
Features: the first step was to build features, with the most important one being distance to Lake POI. We started with collecting Lake POIs represented as a single point and later added lake boundaries that trace the lake, which greatly improved the accuracy of being able to pull listings near the boundary. However, as shown in Figure 4, even then there were many edge cases that lead to mistakes in rule-based listing assignment.


Figure 4. Examples of imperfect POI (left) and complex geography: highway between lake and home (middle), long backyards (right)
These include imperfect lake boundaries that can be inside the water or outside on land, highways in between lake and houses, houses on cliffs, imperfect listing location, missing POIs, and POIs that are not actual lakes, like reservoirs, ponds etc. For this reason, it proved beneficial to combine POI data with other listing signals as ML model features and then use the model to proactively improve the Lake POI database.
One modeling maneuver that proved to be useful here was feature dropout. Since most of the features were also used for generating rule-based candidates that were graded by agents, resulting in labels that are used by the ML model, there was a risk of overfitting and limited pattern discovery beyond the rules.
To address this problem, during training we would randomly drop some feature signals, such as distance from Lake POI, from some listings. As a result, the model did not over rely on the dominant POI feature, which allowed listings to have a high ML score even if they are not close to any known Lake POI. This allowed us to find missing POIs and add them to our database.
Labels: Positive labels were assigned to listings agents tagged as Lakefront, Negative labels were assigned to listings sent for review as Lakefront candidates but rejected (Hard negatives from modeling perspective). We also sampled negatives from related Lake House category that allows greater distance to lake (Easier negatives) and listings tagged in other categories (Easiest negatives)
Train / Test split: 70:30 random split, where we had special handling of distance and embedding similarity features not to leak the label.

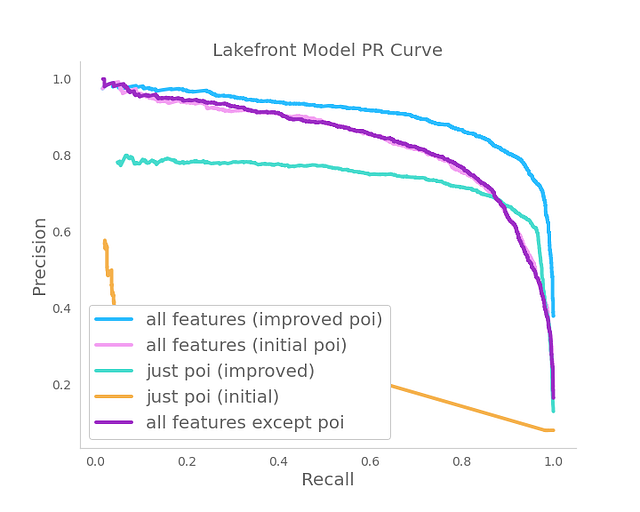
Figure 5. Lakefront ML model feature importance and performance evaluation
We trained several models using different feature subsets. We were interested in how well POI data can do on its own and what improvements can additional signals provide. As it can be observed in Figure 5, the POI distance is the most important feature by far. However, when used on its own it cannot approach the ML model performance. Specifically, the ML model improves Average Precision by 23%, from 0.74 to 0.91, which confirmed our hypothesis.
Since the POI feature is the most important feature we invested in improving it by adding new POIs and refining existing POIs. This proved to be beneficial as the ML model using improved POI features greatly outperforms the model that used initial POI features (Figure 5).
The process of Lake POI refinement included leveraging trained ML model to find missing or imperfect POIs by inspecting listings that have a high model score but are far from existing Lake POIs (Figure 6 left) and removing wrong POIs by inspecting listings that have a low model score but are very close to an existing Lake POI (Figure 6 right)


Figure 6. Process of finding missing POIs (Left) and wrong POIs (Right)
Sending confident listings to production: using the test set Precision-Recall curve we found a threshold that achieves 90% Precision. We used this threshold to make a decision on which candidates can go directly to production and which need to be sent for human review first.
Cover Image ML model
To carry out the second agent task with ML, we needed to train a different type of ML model. One whose task would be to choose the most appropriate listing cover photo given the category context. For example, choosing a listing photo with a lake view for the Lakefront category.
We tested several out of the box object detection models as well as several in-house solutions trained using human review data, i.e. (listing id, category, cover photo id) tuples. We found that the best cover photo selection accuracy was achieved by fine-tuning a Vision Transformer model (VT) using our human review data. Once trained, the model can score all listing photos and decide which one is the best cover photo for a given category.
To evaluate the model we used a hold out dataset and tested if the agent selected listing photo for a particular category was within the top 3 highest scoring VT model photos for the same category. The average Top 3 precision on all categories was 70%, which we found satisfactory.
To further test the model we judged if the VT selected photo represented the category better than the Host selected cover photo (Figure 7). It was found that the VT model can select a better photo in 77% of the cases. It should be noted that the Host selected cover photo is typically chosen without taking any category into account, as the one that best represents the listing in the search feed.

Figure 7. Vision Transformer vs. Host selected cover photo selection for the same listing for Lakefront category
In addition to selecting the best cover photo for candidates that are sent to production by the ML categorization model, the VT model was also used to speed up the human review process. By ordering the candidate listing photos in descending order of the VT score we were able to improve the time it takes the agents to make a decision on a category and cover photo by 18%.
Finally, for some highly visual categories, such as Design, Creative spaces, the VT model proved to be useful for direct candidate generation.
Quality ML Model
The final human review task is to judge the quality of the listing by selecting one of the four tiers: Most Inspiring, High Quality, Acceptable, Low Quality. As we will discuss in Part III of the blog series, the quality plays a role in ranking of listings in the search feed.
To train an ML model that can predict quality of a listing we used a combination of engagement, quality and visual signals to create a feature set and agent quality tags to create labels. The features included review ratings, wishlists, image quality, embedding signals and listing amenities and attributes, such as price, number of guests, etc.
Given the multi-class setup with four quality tiers, we experimented with different loss functions (pairwise loss, one-vs-all, one-vs-one, multi label, etc.). We then compared the ROC curves of different strategies on a hold-out set and the binary one-vs-all models performed the best.
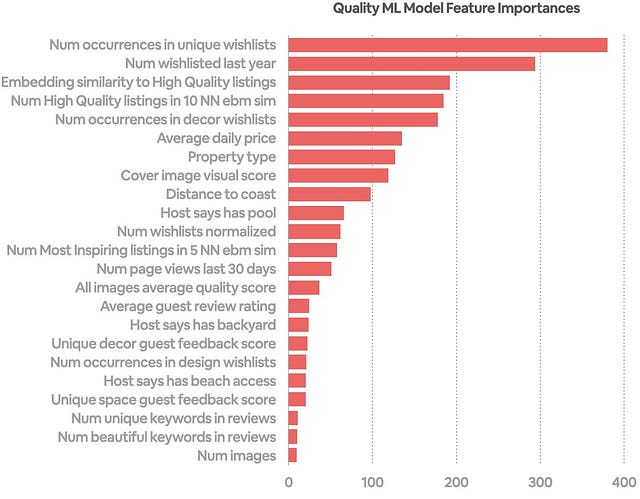

Figure 8: Quality ML model feature importance and ROC curve
In addition to playing a role in search ranking, the Quality ML score also played a role in the human review prioritization logic. With all three ML models functional for all three human review tasks, we could now streamline the review process and send more candidates directly to production, while also prioritizing some for human review. This prioritization plays an important role in the system because listings that are vetted by humans may rank higher in the category feed.
There were several factors to consider when prioritizing listings for human review, including listing category confidence score, listing quality, bookability and popularity of the region. The best strategy proved to be a combination of those factors. In Figure 9 we show the top candidates for human review for several categories at the time of writing this post.
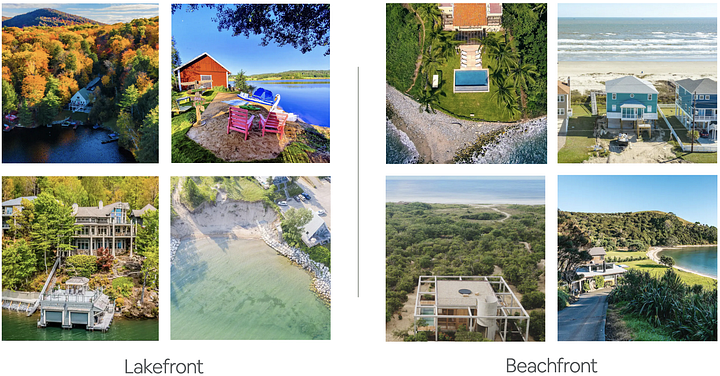
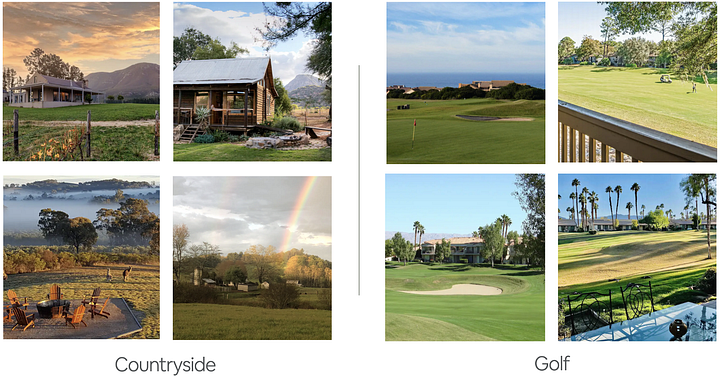
Figure 9: Listing prioritized for review in 4 different categories
Once graded, those labels are then used for periodical model re-training in an active feedback loop that continuously improves the category accuracy and coverage.
Future work
Our future work involves iterating on the three ML models in several directions, including generating a larger set of labels using generative vision models and potentially combining them into a single multi-task model. We are also exploring ways of using Large Language Models (LLMs) for conducting category review tasks
If this type of work interests you, check out some of our related roles!