Uber Freight Carrier Metrics with Near-Real-Time Analytics
While most people are familiar with Uber, not all are familiar with Uber Freight. Uber Freight has been around since 2016 and is dedicated to provide a platform to seamlessly connect shippers with carriers. We’re simplifying the lives of trucking companies by providing a platform for carriers to browse through all available shipment opportunities with upfront pricing and book with the tap of a button, and making the fulfillment process more scalable and efficient.
Providing reliable service to shippers is critical for Uber Freight in order to gain their trust. Because carriers’ performance could significantly impact reliability of Freight’s service, we need to be transparent with carriers about the level to which we are holding them accountable, providing them with a clear view of how well they are performing and, if needed, where they can improve.
To achieve this, Uber Freight developed the Carrier Scorecard to show the carriers several metrics, including engagement with the app, on-time pickup/delivery, tracking automation, and late cancellations. By showing this information in near real time on the Carrier App, we are able to provide feedback to carriers in real time and set ourselves apart from most of our competitors in the industry.
![]()
How We Did It
Getting fast access to fresh data at scale was the key requirement for building the scalable Carrier Scorecard backend.
-
Data Freshness – Performance scores are updated with the least amount of delay once a load is completed or bounced (canceled by the carrier).
-
Latency – Carriers are able to view their performance score in the App with low page loading latency.
-
Reliability – Data can be processed and served reliably, service can be gracefully recovered in case of system failure or code redeployment.
-
Accuracy – Performance metrics must be calculated accurately to avoid excessive inbound disputes.
On-the-fly Aggregation with MySQL®
- Pros
- Reliable database capable of handling high read/write volumes
- Able to support near-real-time data, as MySQL can be updated from streaming data sources
- Cons
- Complex aggregation queries of large datasets are not as performant as we would like and could bottleneck the MySQL instance as we continue to grow and the data size gets larger
- We would need to upsert records in a batch to ensure historical data is up to date. Frequent and large batch inserts would reduce the performance of SELECT queries in flight
Pre-Aggregation of data with MySQL
- Pros
- Since data is pre-aggregated before loading into MySQL, queries are very efficient as they can completely leverage MySQL indexes to pull a single row of data
- Cons
- Unable to support near-real-time metrics, so pre-aggregations would need to be done in batches on a set cadence
- Similar to the solution above, we would need to upsert records in batch to ensure historical data is up to date which could cause performance issues
- We would need to pre-aggregate every necessary use case, potentially increasing the effort to maintain the service as new use cases with aggregation parameters arise down the line
Two OLTP Database Tables
One table stores raw events, and event updates trigger an asynchronous function to update all relevant metrics in the other, aggregated table.
- Pros
- Highly available, low query latency and eventually consistent
- Cons
- Hard to migrate event schema and redefine logic of metrics, because new metrics definition requires recalculation of all the pre-aggregated metrics
- Not very scalable, especially while writing traffic is high
OLAP with Apache Pinotᵀᴹ
Apache Pinot is a realtime, distributed and scalable datastore designed to execute analytical queries at ultra-low latencies required for user-facing analytics. A single logical table (aka hybrid table) can be set up for both real-time and offline ingestion based on the lambda architecture.
- Pros
- Carrier performance data can be measured in real time by leveraging Apache Flink® and Kafka®, then these performance metrics events can be ingested into the real-time portion of the hybrid Pinot table.
- Offline, cleaned data sources from HDFS can be used to fill the Offline portion of the hybrid Pinot table, ensuring any post-completion modifications to the shipment are accounted for.
- Pinot provides many indexing options to enable low-latency aggregations and data selection queries
- Cons
- Business logic would need to be maintained in two separate places. While we already maintain logic to define these performance metrics in offline HDFS, we would also need to keep our real time Flink logic up to date to ensure they output consistent data.
Final System Design
To achieve accurate analytics performed on real-time data, we decided to use the Lambda architecture leveraging Kafka, Flink, and Pinot. Then once data is generated, we cache it using Redis and serve the aggregated metrics through Golang GRPC endpoints to our downstream customers (Carrier App and Web Platform).

Kafka
Apache Kafka is a cornerstone of Uber’s technology stack. We have one of the largest deployments of Kafka in the world and plenty of interesting work has gone into making sure it’s performant and reliable. Kafka can scale easily as the Freight business grows.
Apache Flink is an open source framework used for stateful computations over data streams. In our use case this is necessary for consuming raw events from other backend services, filtering irrelevant events, mapping them to a persisted state, determining performance quality, and outputting to a Kafka topic with a common event schema. Flink can handle very high traffic volumes and also has fantastic fault tolerance capabilities.
Pinot
Apache Pinot is an open source, distributed and highly scalable OLAP datastore which provides low query latency (i.e. within a few seconds for P99 latency) for web-scale applications with thousands of concurrent queries per second. It supports SQL analytics on a single table. It uses a now-popular Lambda data architecture which ingests data from both real-time streaming and batch data sources for historical data.
In the Freight carrier use case, Pinot uses real-time data ingestion from Kafka to cover data created in the last 3 days. For historical data, Pinot ingests from HDFS to cover the data created from 3 days ago to the beginning of time. The offline ingestion pipeline has built-in backfill capabilities for correction of previous data if needed.
Apache Pinot provides rich index optimization techniques like inverted, Star-tree, JSON, sorted column and many other indexes to accelerate the query performance. For example, the Star-tree pre-aggregation index can speed up the queries to summarize the average wait time at facilities. The fast query made it an interactive experience for carriers to check out the wait time on a carrier app before they book a shipment.
Data Schema
The output topic provides a general schema with one row per event. This enables us to add additional event_name options in the future to support future needs. It also provides the base level data points that can be used to aggregate all metrics required for our scorecard.

Query Example
Below is an example of a common query used to pull the total number of jobs completed and miles traveled by a given carrier within a time window.
Values used in the filter clauses are variable based on API request inputs provided by the client.


Data Source
Freight backend services output event data to Kafka through an internal event aggregating service. From that unified event stream topic, we can consume these Kafka events into our Flink stream processing engine. Events from this topic include things such as appointment time changes, the time of actual arrival to appointments, shipment status changes, and many more.
Keyed State
As soon as a shipment is booked by a carrier, a state object is created for the given shipment UUID. This shipment UUID can then be used in the future to retrieve the current state and reference common details about that given shipment.
- Creation: When states are first created, we call other backend services to populate initial details such as stop locations, carrier and driver identifiers, etc., and populate them into the state object.
- Updates: As important update events are processed, the state is updated to reflect the new shipment details that were altered.
- Deletion: As soon as the shipment is completed, events are finalized and the state object is deleted.
Milestones
Whenever a milestone is hit, Kafka messages are output to our sink topic in the data schema we discussed previously. One example of a milestone is for our auto tracking score. If a stop was marked as “Arrived” by the driver instead of by our Ops team, the auto_arrived_at_stop value is output with a boolean_value of True.
Challenges
Schema Evolutions
To be able to restart jobs and pick up where you last left off, Flink will create checkpoints and store them in HDFS. In order to do this with a keyed state, the state objects are serialized, then saved to a checkpoint file. When the job starts back up, the state is loaded from the most recent checkpoint, and the objects are deserialized back into Java instances. The issues arose early on when we attempted to add a new field to the state object. The job failed to load from checkpoint since the serialized objects were not able to be deserialized into the new object instance. In order to solve this issue, we leveraged Apache AVROᵀᴹ to define a schema for the state object. From this schema, AVRO generated objects that can be safely serialized and deserialized even when fields are changed, as long as the changes abide by the schema evolution rules.
Memory Allocation Optimization
When we first started running our Flink job in staging, we consistently hit memory issues and the job would crash. We tried tinkering with the values, but it was not a trivial process getting the configurations just right to ensure our job runs smoothly. Luckily a colleague within Uber shared a hugely helpful presentation on how to properly configure these memory settings. The presentation can be found here if you are interested in learning more.
Hybrid Pinot Table
The explanation below is taken from a documentation excerpt. For more details see here.
For each hybrid Pinot table, under the hood there are two physical tables: one for the realtime data and the other for the offline historical data. The Pinot brokers ensure that the overlap between real-time and offline tables is queried exactly once, by performing offline and real-time federation.
Let’s take this example, we have real-time data for 5 days—March 23 to March 27—and offline data has been pushed until Mar 25, which is 2 days behind real time. The brokers maintain this time boundary.

Suppose, we get a query to this table: select sum(metric) from table. The broker will split the query into 2 queries based on this time boundary—one for offline and one for real time. This query becomes: select sum(metric) from table_REALTIME where date >= Mar 25 and select sum(metric) from table_OFFLINE where date < Mar 25. The broker merges results from both these queries before returning the result to the client.
Query Performance
The following query example is the most common one used against the Pinot table. The query is an analytical query which has aggregation, group-by, and filtering clauses. Currently the query volume is about 40 queries per second. Pinot is able to provide ~250ms P99 query latency on a table with 10G of data. This level of query performance provides good interactive experiences for our Freight app users.
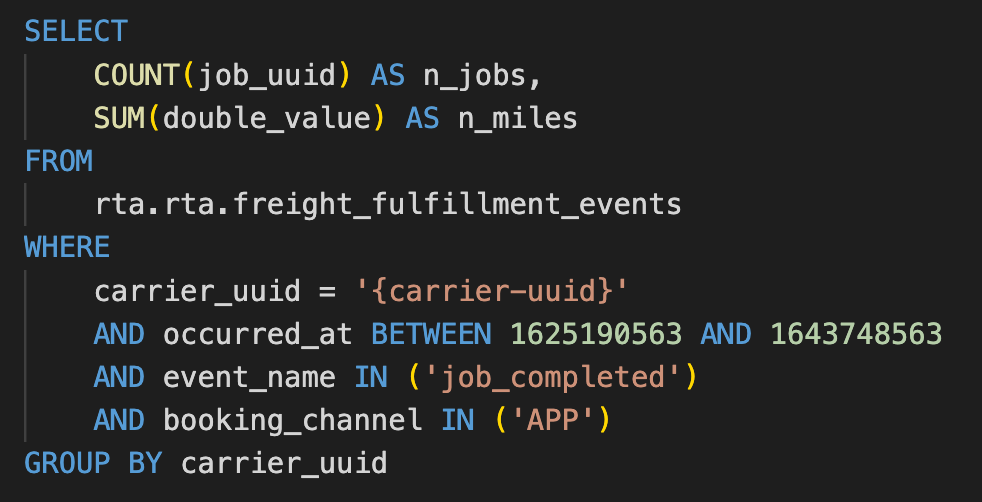 |
Table Optimizations
To achieve the 250ms query latency on a table, we use two types of indexes on Pinot tables:
- Inverted Index for event_name, carrier_uuid, driver_uuid, job_uuid, load_uuid, booking_uuid, stop_uuid, marketplace_type, and booking_channel
The inverted index can speed up queries with corresponding filtering conditions in the WHERE clause by a factor of 10.
- Sorted indexes by carrier_uuid in the offline ingestion pipeline, which reduces the size of our table by half and thus reduces the query latency.
- Pinot is a columnar storage, and columns like load_uuid, job_uuid, carrier_uuid, and driver_uuid could have the same value across multiple records while data is physically sorted, therefore significantly improving the compression ratio
- carrier_uuid and event_name were always used as filters in the query, and physically sorting them could reduce the number of segments loaded during query time
Golang GRPC Service
Neutrino Presto
Neutrino is a primary query gateway to access the Pinot datasets at Uber. It is a slightly different deployment of Presto® where a coordinator and a worker runs on each host and is capable of running each query independently. Neutrino is a stateless and scalable regular Java microservice hosted on Mesos containers. It accepts PrestoSQL query, translates it into Pinot query language, and routes it to appropriate Pinot clusters. Main difference between native Presto and Neutrino Presto is that Neutrino does aggressive query pushdown to maximize the utilization of the underlying storage engine. Please check out Uber’s talk in the Presto Meetup to understand how we leverage open source technologies like Presto to power high throughput and low-latency analytics at Uber.
Caching
When users open or refresh the Carrier Scorecard in the mobile app, 5 metrics will be fetched concurrently, which translates to 9 Neutrino queries, due to some metrics requiring more than one Neutrino query. P99 latency of our Neutrino queries is around 60ms, in order to reduce traffic to Neutrino and improve external latency, we added a Redis cache in front of Neutrino, which stores aggregated metrics. A TTL of 12 hours was set and we use the following strategies to ensure cache consistency as new events continue to flow in. On average, we were able to achieve >90% cache hit rate.
-
Cache Aside: When the request key is not yet cached during a read (cache miss), we query Neutrino and store the resulting metrics in Redis.
-
Event driven cache refreshing: When a raw milestone event occurs, we immediately invalidate all relevant keys in Redis. After a 2-minute wait period, we fetch the new results for all keys that were invalidated from Neutrino and update Redis. The 2-minute wait time is to ensure events were ingested into Pinot’s real-time table.
Impact
By providing freight drivers with easy access to their current performance scores, we observed a statistically significant boost across all the key metrics.
- Late Cancellations → -0.4%
- On-Time Pick Up → +0.6%
- On-Time Drop Off → +1.0%
- Auto Tracking Performance → +1.0%
These performance improvements resulted in cost savings of $1.5 million just in 2021.
A deep dive by performance rating reveals that carriers who were rated as ‘At Risk’ had shown the most improvement.
Not only did this show a high business impact from a cost saving perspective, but also from a user experience perspective. Here is one such testimonial from a carrier on the Uber Freight platform, who found this new feature beneficial in her own business!
Conclusion
In this blog, we describe the design and implementation of the backend for Carrier Scorecard in Uber Freight Carrier App, using Apache Pinot and Uber’s streaming infrastructure. This new architecture works amazingly well to generate the analytical metrics at low-latency (~250ms P99 & ~50ms P50), which otherwise would require complex queries on multiple online datastores. Our service has been running reliably in production for over a year now with very little maintenance overhead.
If problems like this interest you, come join us at Uber Freight. We are hiring!
Apache®, Apache Kafka®, Apache Pinot, Apache Hadoop®, Apache Hive, Apache Flink®, Apache AVRO®, Kafka®, Pinot, Hadoop®, Flink, and Hive are trademarks of the Apache Software Foundation.
Presto is a registered trademark of LF Projects, LLC.
Oracle, Java, and MySQL are registered trademarks of Oracle and/or its affiliates. Other names may be trademarks of their respective owners.