How to investigate the online vs offline performance for DNN models
Predictive model performance gap between offline evaluations and online inference is a common and persistent challenge in the ML industry, often preventing models from achieving their full business potential. At DoorDash, this issue is particularly critical for deep learning models, as it impacts multiple teams across domains. Bridging this gap is essential for maximizing the business value of these models.
The Ads Quality ML team encountered the same challenge for our latest few ranking model iterations. In this blog, using the latest launched model iterations as a case study, we will walk through the debugging process, and share a scalable methodology framework for investigating and resolving these discrepancies.
By adopting the solution proposed in the blog, we reduce the online-offline AUC gap from 4.3% to 0.76%.
Our experience highlights critical areas such as feature serving consistency, feature freshness, and potential concerns when integrating real-time features for model serving. These insights can guide future efforts to improve offline and online performance alignment.
Restaurant Discovery Ads, the primary entry point for ads in the app, contributes the largest share of ad revenue. Key milestones since early 2023 are summarized in Fig-1. After evaluating various model architectures, we have adopted the Multi-Task Multi-Label (MTML) model architectures.
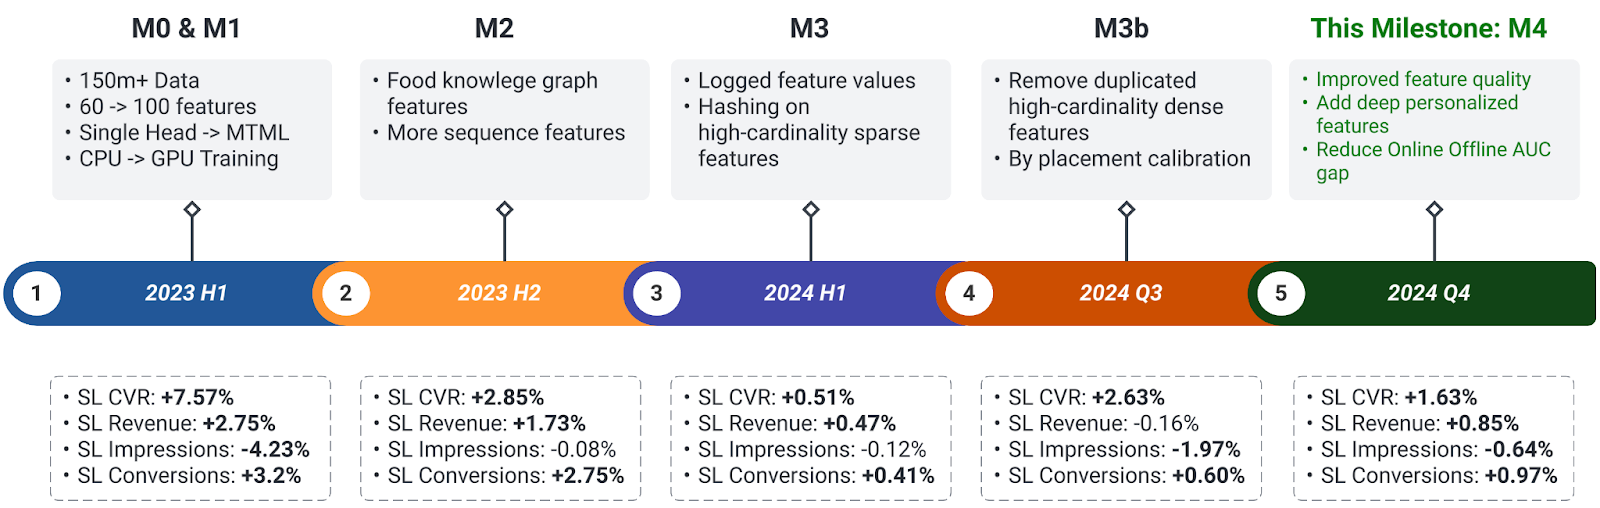
Figure 1: Restaurant Discovery Ads Ranking Deep Learning Milestones
The goal for this milestone (M4), Multi-MTML V4 is to add more features to further improve the model performance. For the online-offline AUC gap investigation in the middle of this milestone, on top of existing features, we added more than 40 dense features.
| Feature Category | Feature Data Type | Description |
| Existing Features | Dense Features | Mostly consumer engagement features |
| Sequence Features | Consumer-engaged business/food/cuisine tag sequence & contextual features | |
| Newly Added Features | Dense Features | Consumer promotion-related featuresAdditional consumer engagement features |
Table 1: Model for investigation Feature details
We developed a model using widely accepted offline training data construction rules, where impression data is joined with feature values from the previous day. This approach simulates the scenario of leveraging 'yesterday's' feature values for ‘today's’ model inference.
However, we observed a 4% decline in AUC during real-time online inference compared to offline evaluation. Notably, the online AUC was also much lower than the baseline achieved by the current production model.
We begin with a hypothesis-driven approach, where we design experiments to validate or invalidate each hypothesis. The initial hypotheses include:
- Feature Generation Disparity: This often arises when the offline feature pipeline does not mimic the online environment, leading to discrepancies in real-time predictions.
- Data Distribution Shift (Concept Drift): Changes in the underlying data distribution over time, such as seasonal changes in consumer behavior, could significantly impact model generalization.
- Model Serving Instability: Issues with the model serving infrastructure, such as latency or incorrect model versions, might be affecting online performance.
For each hypothesis, we conduct experiments, analyze the data, identify root causes, apply fixes, and redeploy the model. This iterative process continues until all performance gaps are resolved or new issues emerge.
To test feature disparity, we regenerate the evaluation dataset using the same online impression traffic (from the shadow) with the same offline feature join process. We then run model inference and evaluate AUC.
- If the Reply AUC is similar to that from previous offline evaluation, it confirms the offline to online performance recession is due to feature disparities.
- If the Reply AUC aligns with the shadow but remains lower than the previous offline AUC, it indicates the concept drift.
| Eval Date Range | Model | Feature Generation | Online vs Offline | AUC |
|---|---|---|---|---|
| One Week’s data in September | Baseline (Prod Model) | Online Logging | Online | Baseline Value |
| New model | Online Logging | Online Shadow | -1.80% | |
| New model | -1d offline join new added features | Offline Replay | +2.05% | |
| One Week’s data in June | Baseline (Prod Model) | Online Logging | Offline | +0.77% |
| New model | -1d offline join new added features | Offline | +2.105% |
Table 2: AUC Benchmarks for offline Reply
- When the model first trained offline, the AUC on the eval set had 2.1% AUC improvement compared with the baseline value; when shadowed online on the week of 09/09, it was -1.8% decrease.
- During the shadowing, we did not see any obvious outage on the Logging service (hence can temporarily rule out hypothesis #3 of serving instability).
- Replaying the evaluation offline with the same feature generation process as training data on the shadow impressions, the AUC is 2.05% improvement, which is very close to 2.1%.
- The above evidence suggests the main culprit is feature disparity.
In the following section, we dive deeper to understand the feature disparities.
There are two potential root causes for such online and offline feature disparities:
Feature Staleness occurs when most recent feature values are not available during serving. It is primarily due to at least -1d or -2d delays in the feature pipeline, with minor delays from feature uploads occurring a few hours after the data is ready.
Cached Residuals occur when feature values are null or no longer available after the most recent pipeline run. Since the Online Feature Store only overrides existing keys or adds new ones without evicting the old entries, outdated data can persist.
To gain further insights, we conduct a deep dive for newly added topmost important features to better understand the feature serving dynamics.
Both of these cases are difficult to address perfectly using offline feature joining logic. Since:
-
For Feature Staleness, the SLA varies across features due to the variances in the pipeline implementations, processed data volume, availability of computation resources, feature uploading velocities, etc.
-
For Cached Residuals, since it’s unknown how many existing feature values in the Online Feature Store are absolute values, thus hard to tell which entity suffers from this case mostly.
-
Feature staleness - The current -1d offsite for offline feature join is a very aggressive choice. Analysis of online logging shows that most feature values used for a given prediction were from the consumer’s engagement 2-3d earlier, indicating a long SLA from data generation to feature availability.
-
Cached residuals - We assume that any feature values older than 4 days are likely due to long-lived historical values remaining in the Feature Store. This results in a lower missing rate during online serving and is a key factor contributing to feature disparity.
-
Ubiquity: Both Feature Staleness and Cached Residuals impact most features, though the severity of these issues varies depending on the feature.
-
AUC Gaps: By generating simulated data with longer feature active_date offsites (from 1d to 3d/4d), we observed a reduced AUC gap, validating the impact of these issues.
Features most impacted by Cached Residuals are likely to have these characteristics:
- High cardinality (such as cross features at consumer levels) and volatile values (e.g., values change frequently from day to day).
- Aggregated over short time windows, e.g. aggregated features with past 1 day/7 day data, making them more susceptible to outdated data being served from the cache.
For the 10 most important new features, we have listed their mostly observed staleness and % of fetched residuals during online serving:
| Feature Name | Feature Aggregation Level | Feature Aggregation Time Window | Feature Staleness | Feature Missing Rate | % of cached residuals |
| Feature 1 | Consumer level | Past 1 year | -3d/-4d | 2.77% | 1.15% |
| Feature 2 | <Consumer, Store> level | Past 3 month | -3d | 76.20% | 45.6% |
| Feature 3 | <Consumer, Store> level | Past half-year | -3d | 70.19% | 23.6% |
| Feature 4 | Consumer level | Past 1 year | -3d/-4d | 2.77% | 6.07% |
| Feature 5 | Consumer level | Past 3 months | -3d | 45.18% | 4.56% |
| Feature 6 | Consumer level | Past 3 months | -3d | 76.19% | 31.0% |
| Feature 7 | Consumer level | Past 1 month | -2d | 76.19% | 31.0% |
| Feature 8 | Store level | Past 3 months | -3d | 0.92% | 34.9% |
| Feature 9 | Consumer level | Past 3 months | -2d | 45.18% | 4.55% |
| Feature 10 | Store level | Past 1 day | -3d | 23.50% | 24.7% |
Table 3: Cache Residuals of the 10 most important added features
Online vs offline feature distribution
For served features with a higher concentration of cached residuals, we observed a noticeably lower missing rate online compared to offline. This discrepancy is reflected in the misalignment of feature distributions between online and offline, as seen in Fig-2. In the examples below, missing values for both features are imputed as 0, leading to pronounced peaks around 0 in the distributions.
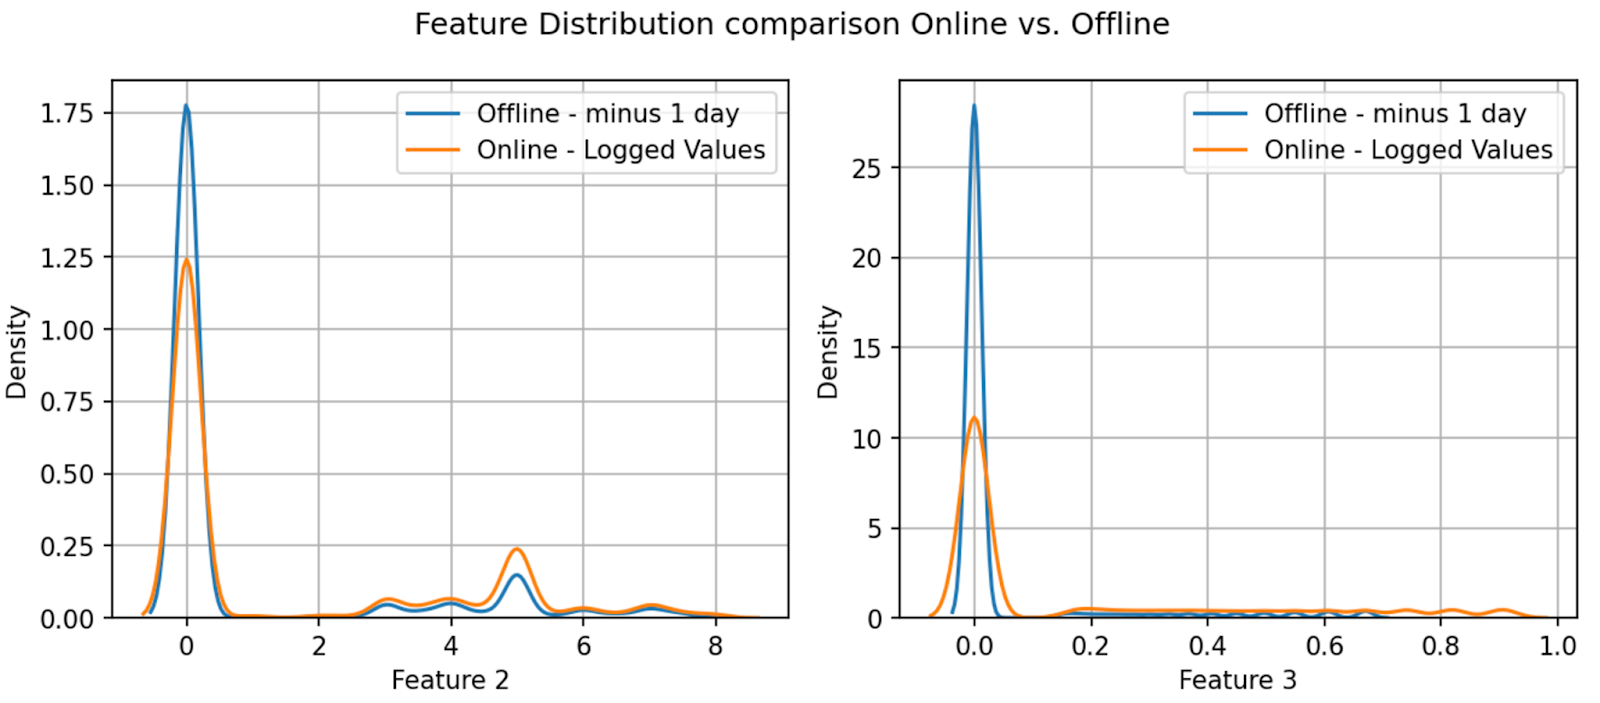
Figure 2: Feature Distribution Online (red) vs Offline (blue)
Feature-to-feature variations
The actual staleness varies across features due to the variances in the pipeline implementations, processed data volume, availability of computation resources, and feature uploading velocities. Below are two examples to illustrate such variations.
- Feature 1: -3d to -4d delay
- Feature 10: -1d delay
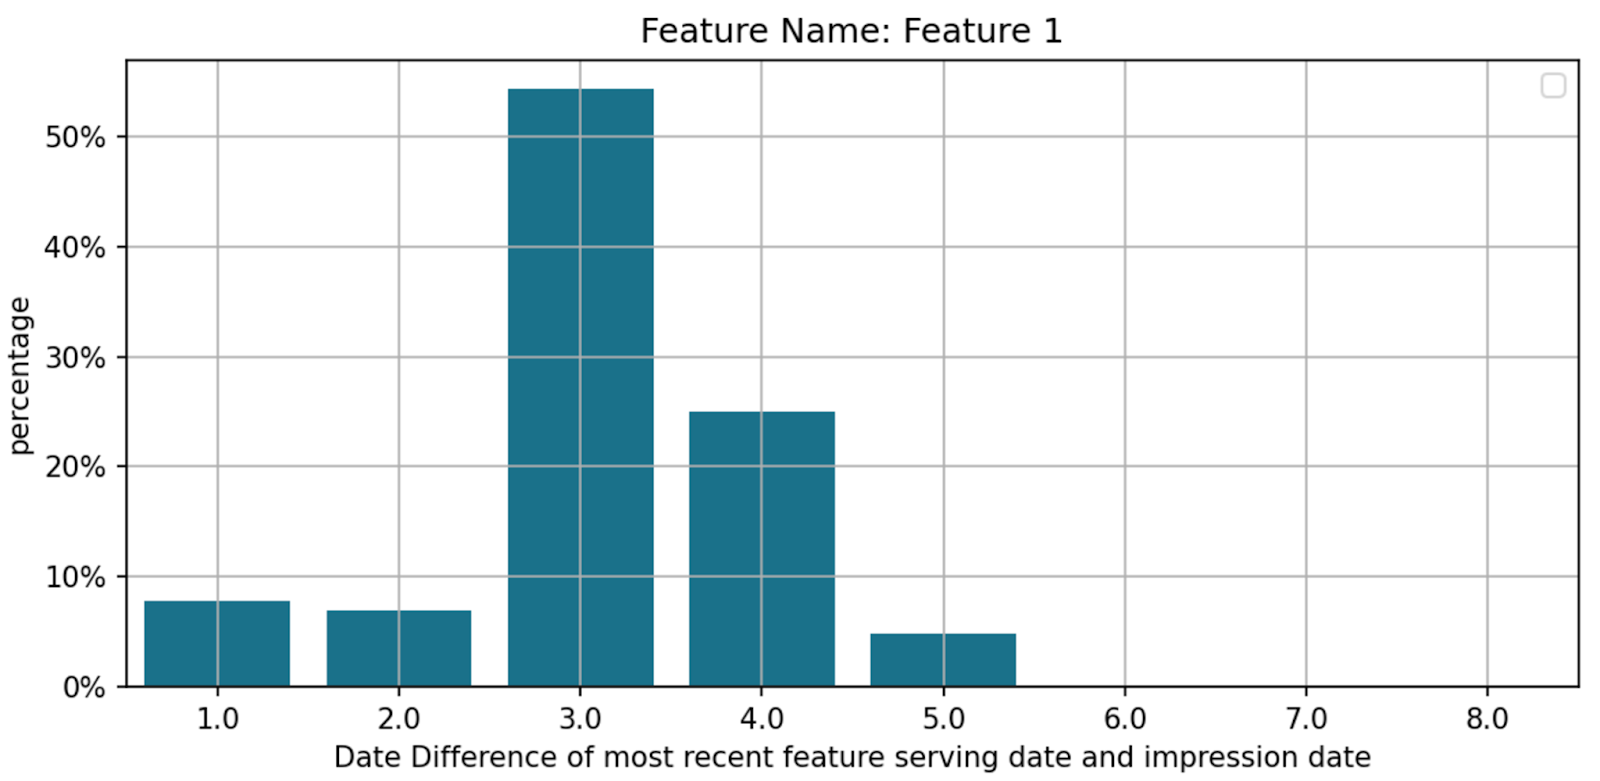
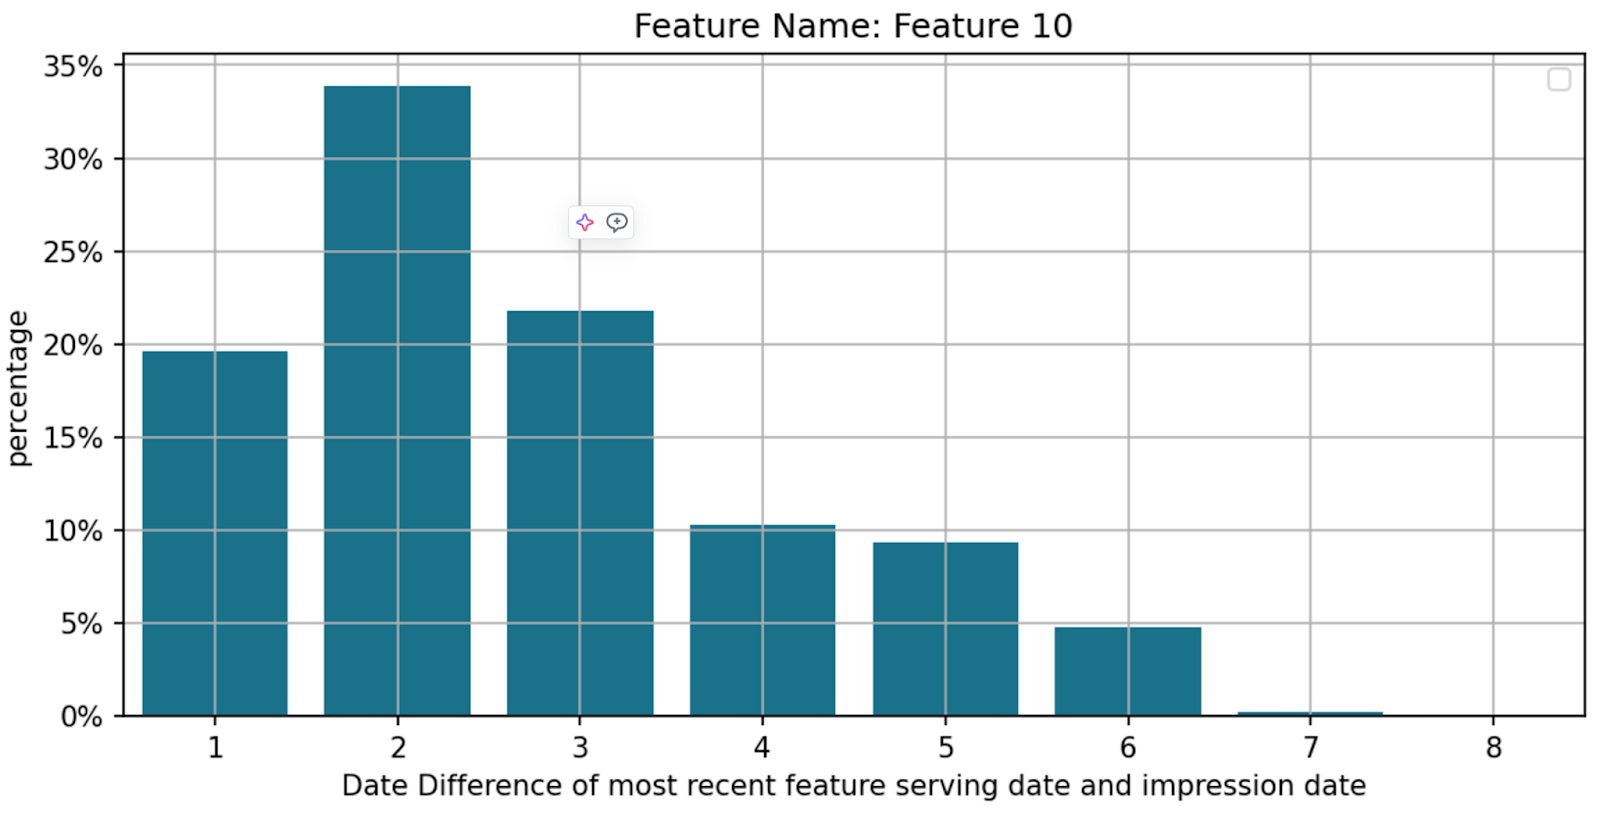
Figure 3: Feature Staleness
* Disclaimer: Figure 3 may underestimate feature staleness, as small day-to-day feature value changes make it hard to pinpoint the exact feature uploading date. This data should be taken with a grain of salt.
Day-to-day feature value change
For most features, only less than 10% of feature values are different from previous days, while features with small aggregation time windows have more than 35% difference.
| Feature Name | Feature Aggregation Level | Feature Aggregation Time Window | % of entities change** | % of feature value mismatch*** |
| Feature 1 | Consumer level | Past 1 year | 0.0258% | 9.69% |
| Feature 2 | <Consumer, Store> level | Past 3 month | 1.04% | 5.2% |
| Feature 3 | <Consumer, Store> level | Past half-year | 3.36% | 11.3% |
| Feature 4 | Consumer level | Past 1 year | 0.0258% | 9.68% |
| Feature 5 | Consumer level | Past 3 months | 1.0% | 8.37% |
| Feature 6 | Consumer level | Past 3 months | 1.04% | 4.66% |
| Feature 7 | Consumer level | Past 1 month | 1.04% | 4.66% |
| Feature 8 | Store level | Past 3 months | 0.09% | 4.38% |
| Feature 9 | Consumer level | Past 3 months | 1.04% | 4.78% |
| Feature 10 | Store level | Past 1 day | 0.436% | 35.7% |
Table 4: Cache Residuals of the 10 most important added features
** the percentage of entity_ids that did not show up in the previous data.
***the percentage of feature values that are different from the previous day.
To summarize the above investigation and close the hypothesis validation loop, we build new training and evaluation datasets and run evaluations. For the features inherited from the current model, we continued to use the Real-time Serving logged values in all the training sets.
- Rebuild 4 datasets with impression data joining with minus 1/2/3/4 day feature offset dates for both training and evaluation datasets and train 4 models respectively.
- Evaluate 4 model performances on 2 datasets (date ranges are different between them):
- Offline Evaluation dataset - The eval dataset with the same feature offset dates as training.
Shadow Log dataset - All feature values are logged values from online real-time model serving.
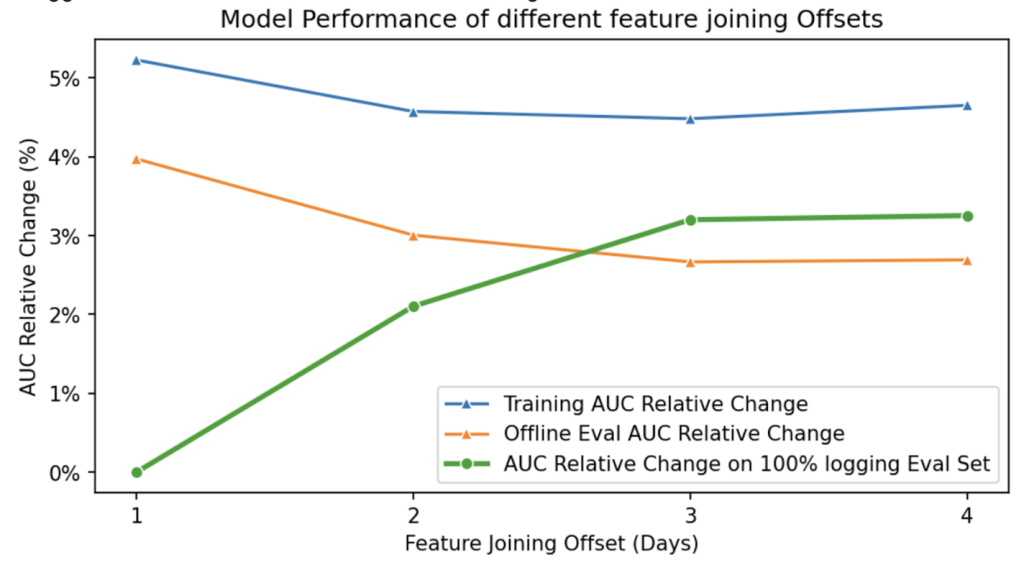
Figure 4: AUC Relative Changes on models trained by -1/2/3/4 day feature offsets
From the above Fig-4, if we trace out the offline AUC vs Feature offset days (e.g. delayness), it suggests that model performance degrades as feature freshness decreases, highlighting the importance of timely feature updates in maintaining optimal model accuracy.
The most significant AUC drop comes from 1d delay to 2d. The rationale for picking offline AUC instead of online as the benchmark is to rule out the impact of feature disparity.
Short-term: Generate evaluation sets with different feature offsets (e.g., -2d, -3d, -4d) and select the offset closest to production AUC. Use this offset to create training data and build the model.
Long-term: Enable online logging for new features. However, there’s a clear trade-off between development speed and data accuracy, which needs careful consideration during the project planning stage.
| Solution | Pros | Cons |
| Short-term | Reduces AUC discrepancy immediately | Does not address cached residuals |
| Long-term | Effectively resolves both cached residuals and feature staleness.Improves model generalization. | Has the trade-off between development speed and data accuracyRequires system stability improvements to support feature logging of larger traffic. |
Table 5: Comparison between short-term and long-term solutions
By adopting the short-term solution proposed in the blog, we reduce the online offline AUC gap from 4.3% to 0.76% for our latest Restaurant Discovery Ads Ranking model Deep Learning Iteration. Combined with other feature improvements, this iteration achieved the largest business gain among Ads Ranking model Iterations this year.
This investigation not only resolved immediate performance gaps but also highlighted the importance of feature alignment in real-time systems. The methodology developed here can serve as a blueprint for addressing similar challenges across other domains. Moving forward, adopting robust logging systems and scaling feature pipelines will ensure that our models continue to drive impactful business outcomes.
Scale of the Business: The ads business has grown 3-5x over the past year, leading to increased data volume and feature complexity, which has amplified the impact of feature staleness and cached residuals.
Model Architecture: Previously, tree-based models were less sensitive to feature disparities because they bucketize values into leaf nodes, meaning small differences often have minimal impact. However, DNNs, being parametric models, are much more sensitive to precise feature values, where even slight deviations can affect the model's output. This shift to DNNs has made the online vs. offline gap more significant.
Special thanks to Hebo Yang, Mark Yang, Ferras Hamad, Vasily Vlasov and Arvind Kalyan from Machine Learning Platform for all the collaborations on Ads User Engagement Prediction Modeling.
Interested in solving these kind of problems? Come join us!