Enhancing Uber’s Guidance Heatmap with Deep Probabilistic Models
At Uber, giving high quality guidance to drivers is crucial for smoothing the learning curve for new drivers and improving driver retention. Our internal research shows that a major pain point drivers face is that it often takes weeks of trial and error for drivers to figure out the nuances of their particular market, resulting in churn and frustration.
To help address this issue, our AI team has developed probabilistic prediction models that power guidance tools like the Heatmap (Figure 1), giving drivers information for making decisions about when and where to drive. These insights can help significantly improve the driver experience and enhance overall platform efficiency by highlighting areas with greater demand and opportunities.
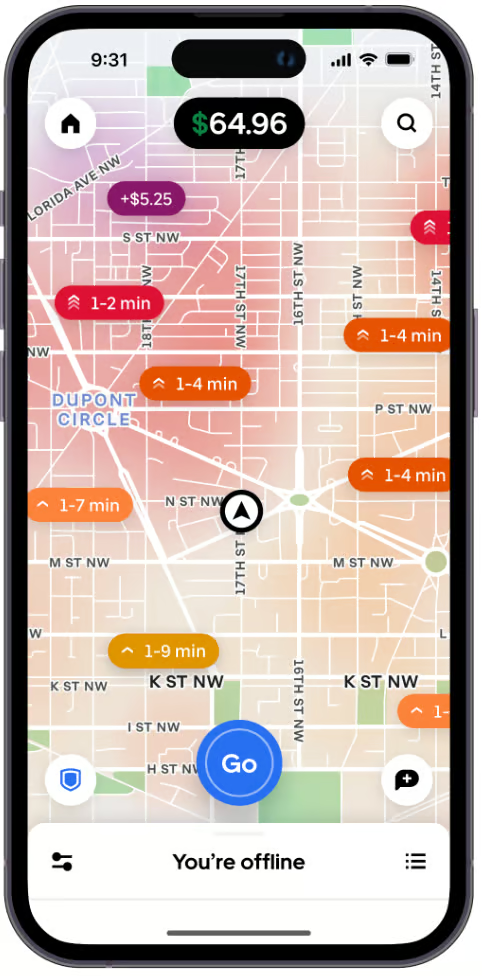
Figure 1: In-app screenshot of the earnings heatmap.
The probabilistic models which power the Heatmap use a Deep Neural-Network architecture which outputs a distribution of forecasted earnings outcomes. Our work in this area allows us to capture real-world variability in demand and provide useful insights for drivers.
In this blog, we dive into the technical challenges we faced, such as handling noisy data, creating well-fitting probabilistic models, and deploying ML models at scale in a real-time production system that serves millions of users.
Our probabilistic forecasting models power the Heatmap, which provides granular, location-based information for drivers. The heatmap updates every 10 minutes, ensuring drivers receive up-to-date estimates highlighting areas forecasted to have above-average earnings opportunities. To do this, we designed our model to predict earnings per hour (EpH), since this allowed us to account for real time fluctuations in rider demand, surge pricing, and holiday seasonality. It also provided coverage when considering granular geo locations and times.
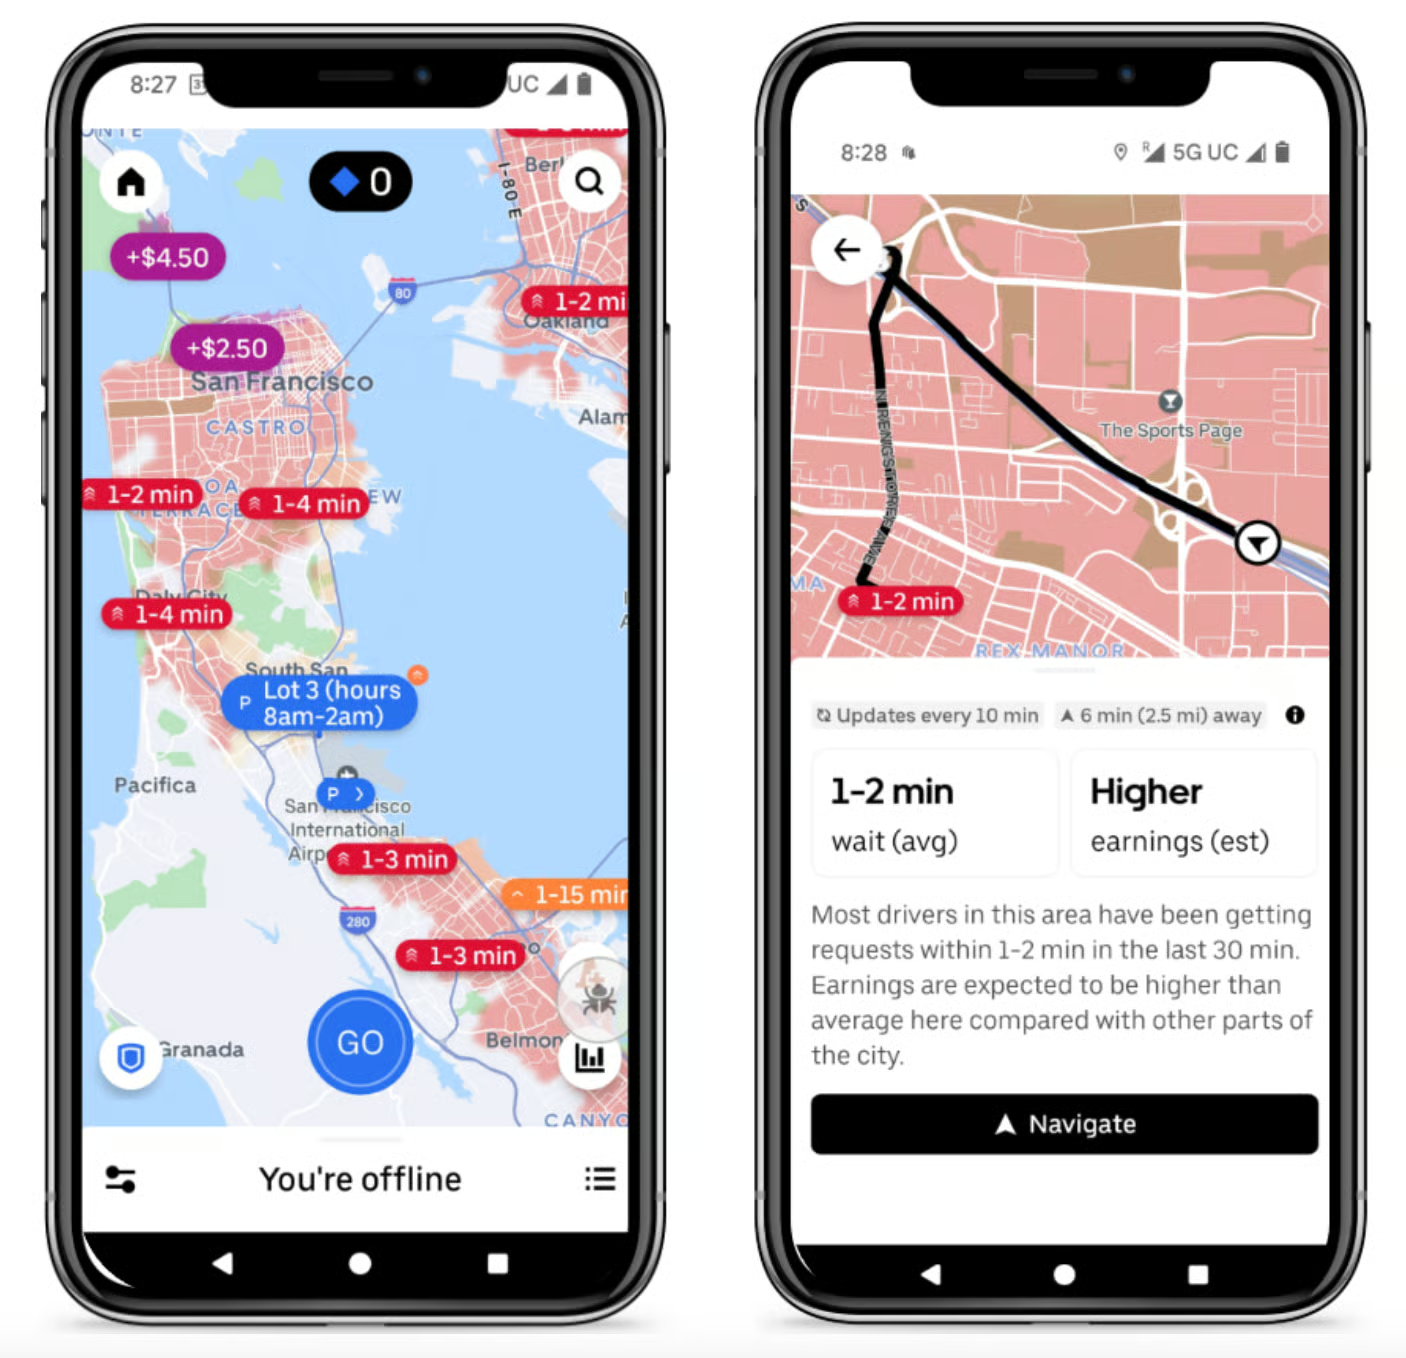
Figure 2: Zoomed in view of the Heatmap.
However, predicting earnings posed challenges we knew we’d need to surmount. For example, earnings vary widely across different drivers, locations, and times, especially at hex-9 granularity (see how Uber groups together geo-locations into hexagons). Multiple sources of randomness contribute to this: time to first request, abnormal demand fluctuations, how long and how lucrative that trip will be, and the dropoff location and its continuation potential.
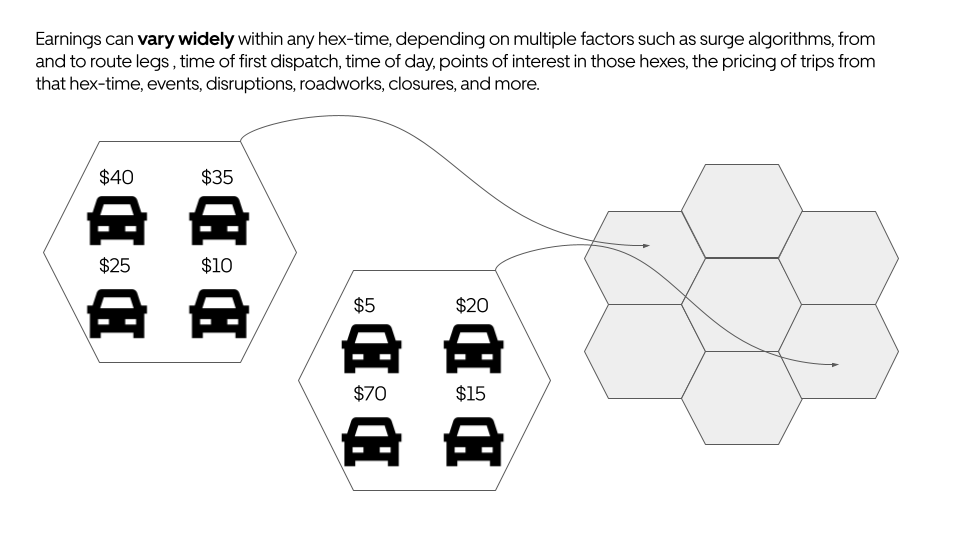
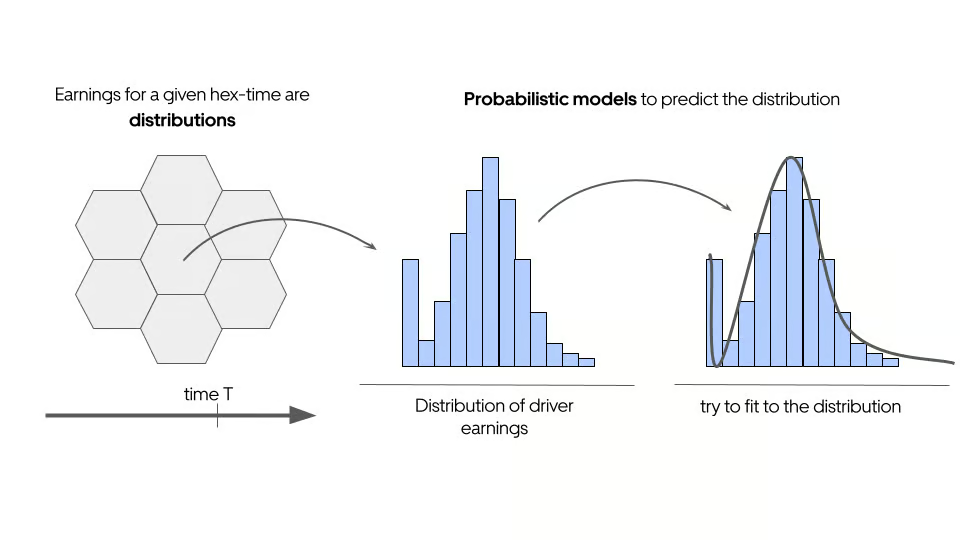
Figure 3: High-level depiction of how driver earnings for a given (hex, time) are aggregated into distributions.
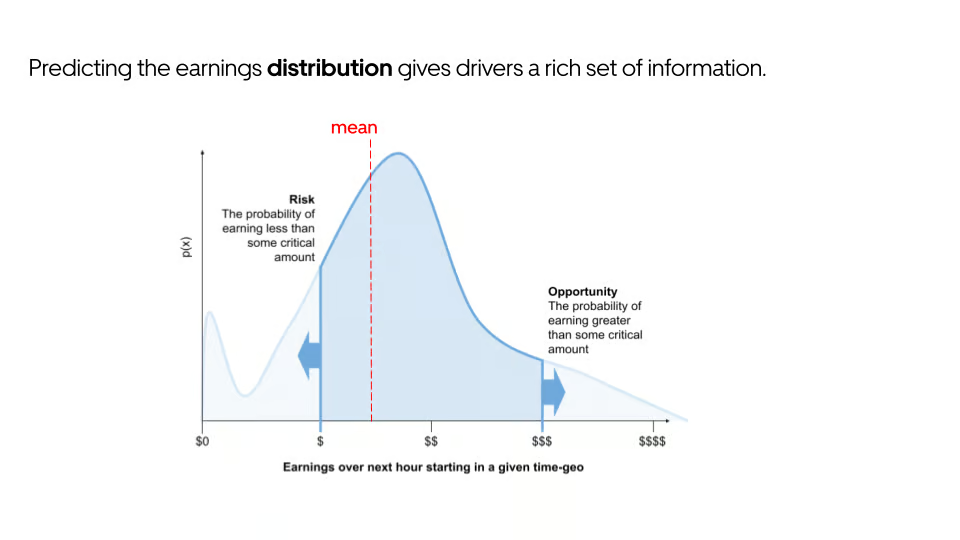
Figure 4: Predicting the whole earnings distribution gives information on risk (chance of earning much less than the mean) versus opportunity (chances of earning much greater than the mean).
This section describes the evolution of our earnings predictions approach over time, from simple tree-based regression models to probabilistic deep-learning models.
The first version of our Earnings Predictions model used XGBoost to predict mean EpH with mean squared error (MSE) loss. This approach leveraged geohashes, historical EpH, and near-real-time (NRT) surge and wait time as features. This model provided good results, but we knew we could do better.
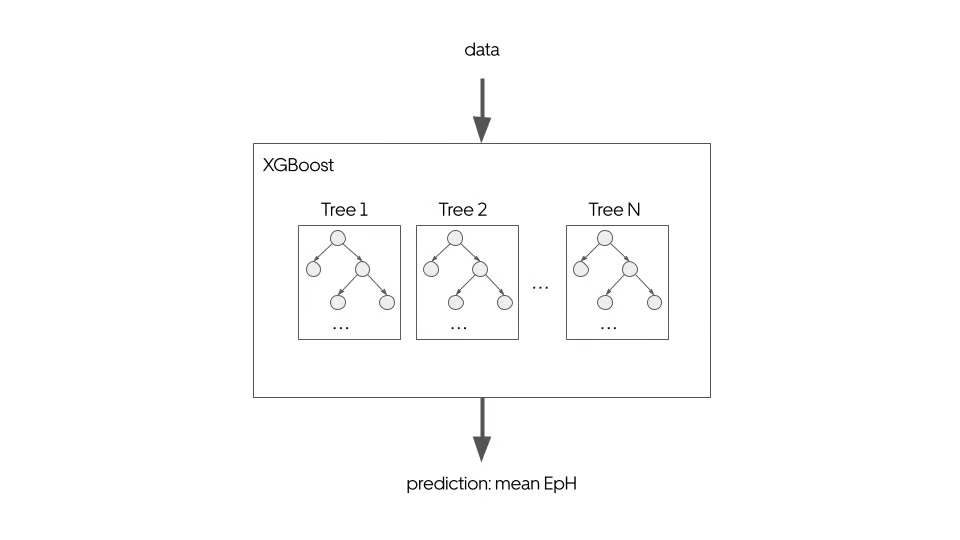
Figure 5: Our original approach used a tree-based regression model to predict mean EpH.
With that in mind, we focused on further improving accuracy and incorporating uncertainty into our new model.
As a first step, we assumed EpH at a given hex-time could be modeled as a Gaussian (normal) distribution. We trained a deep neural network model with a Gaussian negative log-likelihood (NLL) loss to fit a Gaussian distribution (Figure 6). Since a Gaussian can be fully described by two parameters—mean and variance—this model has two output heads. The mean and standard deviation output by the model can be thought of as parameterizing the entire predicted distribution of earnings over the next hour for a given location (Figure 7).
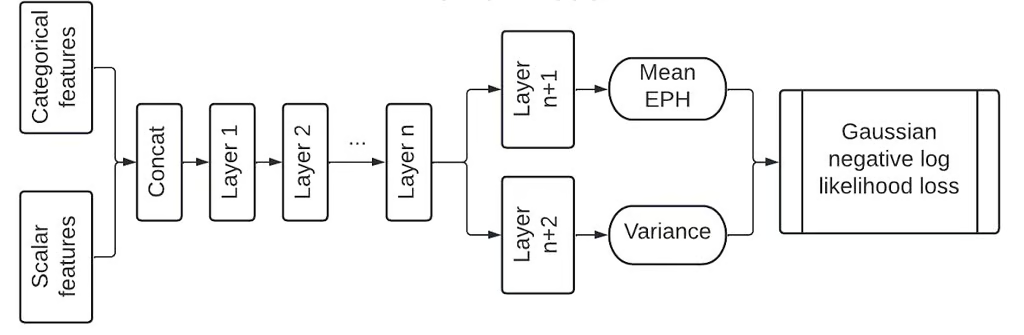
Figure 6: Initial approaches involved fitting the driver earnings distribution for a given (hex, time) to a single Gaussian (parameterized by the mean and variance).
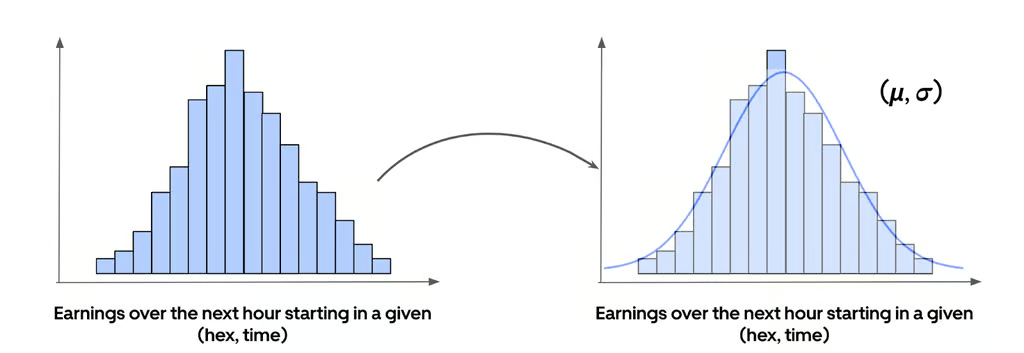
Figure 7: Predicting the standard deviation gives an estimate of the width/uncertainty of the earnings distribution.
Although modeling the distribution of EpH for a given hex-time as a Gaussian worked as a first approximation, the distribution of actual individual EpH can be much more complex. The typical distribution of individual EpH at a hex-time exhibits multiple peaks, which goes against our original assumption of a Gaussian distribution with a single peak.
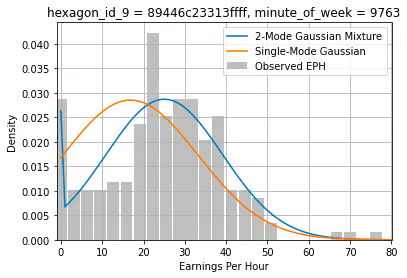
Figure 8: Example of the distribution of EpH at a given hex-time (gray), the best fit Gaussian distribution (orange), and the best fit 2 mode Gaussian Mixture Model (blue).
To better fit our data, we transitioned to GMMs (Gaussian Mixture Models) where the number of modes was treated as a hyperparameter. GMMs are a generalization of Gaussians (that is, a GMM with 1 mode is equivalent to a Gaussian) and allow for predictions of multi-modal distributions, which better represent the complex earnings patterns observed in our data (Figure 8). Ultimately, we experimented with tuning the number of Gaussian modes, and found that a GMM with 3 modes resulted in the lowest negative loglikelihood loss.
Our final model incorporates over 60 contextual, NRT, and historical features, such as demand signals, surge multipliers, and historical earnings. These features are transformed into embeddings and sent through a deep neural network. Optimizing for a GMM NLL, the model has multiple heads to output the weight, mean, and standard deviation of each mode as well as the overall mean and overall standard deviation of the mixture (Figure 9). Predictions undergo post-processing, including spatial and temporal filtering, before being displayed in the Earnings Heatmap to ensure usability.
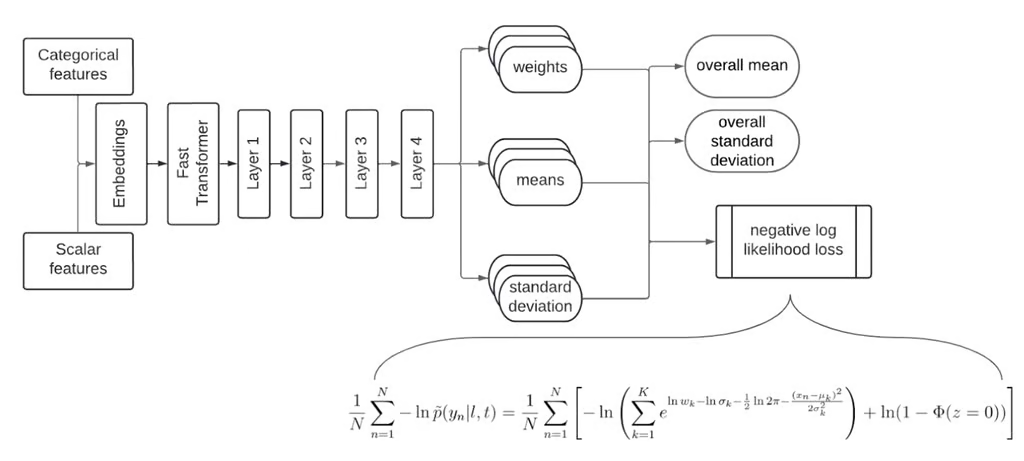
Figure 9: Neural network architecture for the deep Gaussian Mixture model.
This model fits the driver earnings distribution with a linear combination of Gaussian components. For each component, the model outputs a weight, mean, and standard deviation. The loss shown is the negative log likelihood of observing the earnings distribution, conditioned on the Gaussian mixture predicted by the model.
Several challenges emerged while refining our models:
- Lack of individual earnings. Our initial dataset only contained aggregated mean EpH for each hex-9 and time. Since averaging erases variability information, we reformulated our training to predict based on individual rather than group-level earnings.
- Earnings attribution. There are many possible options for how to attribute earnings over an hour to a particular hex-time. Our initial strategy was intuitive and simple to implement, but it had the effect of introducing noise to the location and time of trip dispatches, which are the source of earnings. We altered our attribution strategy to better differentiate high-earning hex-times with short wait times from low-earning hex-times with long wait times.
- Data categorization. Though EpH naturally differs across product types, there was no clear way to group drivers that was flexible to the different lines of business and vehicle types on the Uber platform worldwide. We created our own categorization based on dispatchability information that could encompass and differentiate between lines of business and vehicle types.
- Holiday volatility. Model performance degraded during holidays, so holiday information was added as features to the model.
- Post-processing issues. After the model outputs predictions, there are additional post-processing steps specific to each product that ensure a good user experience. Earnings Heatmap required smoothing techniques to mitigate “islanding” effects (isolated high predictions) and “donuts” (gaps in predictions around high-earning areas).
- Model underprediction bias. The Gaussian Mixture models used here have distributions truncated at 0, since earnings can’t be negative. While this truncation was correctly accounted for in the model’s loss function and optimization procedure, it was incorrectly omitted when computing the overall distribution mean from the individual Gaussian modes. This led to an underprediction bias, which was corrected for once we appropriately computed the expectation value for a mixture of truncated Gaussians.
These refinements led to a more robust and accurate system.
Probabilistic models now inform how we filter and present earnings insights to drivers. When surfacing hex-9 areas in the Earnings Heatmap, we don’t highlight areas where earnings might appear high but have excessive variance. By integrating variance as a filtering condition, we prevent misleading signals and provide drivers with actionable insights.
Most importantly, our predictions have driven up average earnings per hour for exposed users, and created measurable impacts in the number of completed trip hours.
Looking ahead, we’re exploring several enhancements that will improve the heatmap and make it easier to ingest and understand for drivers:
- More real-time features. Incorporating additional data, such as real-time offer counts, to refine predictions.
- Show areas differently according to variance. We might want to surface the variability and reliability of earnings regions directly to drivers via UI affordance, rather than just filtering out high-variance areas.
- Expansion beyond just rides guidance. Expanding our guidance products for couriers, cross-dispatch drivers, and more.
- Longer-term forecasts. Extending predictions beyond one-hour windows to support broader planning use cases, for example, when drivers have specific constraints around where they need to end up at the end of the day, or earnings targets to hit per week or month.
- Personalized guidance. Our guidance products don’t fully account for a driver’s current location and their travel times to displayed areas; this is an area we’d like to work on.
Our probabilistic prediction models represent a significant achievement when it comes to earnings information available on the Uber app. By capturing the distribution of potential earnings, we’ve built tools that are accurate, actionable, and tailored to individual drivers’ needs.
Stay up to date with the latest from Uber Engineering—follow us on LinkedIn for our newest blog posts and insights.