Uber’s Journey to Ray on Kubernetes: Resource Management
This is the second blog in a two-part series that describes Uber’s journey to Ray® on Kubernetes®. In the first part, we introduced our motivation to the problem and the approach we took to set up a Ray-based job management system. In this blog, we zoom into how we run this job management platform on top of Kubernetes. In particular, we talk about the enhancements we made to Kubernetes to be able to run these Ray-based jobs.
In the world of containerized applications, Kubernetes has emerged as the de-facto standard for orchestration. However, as we push the boundaries of large-scale, multi-tenant environments, we discovered that Kubernetes’ native resource management capabilities, while robust, leave room for optimization.
In addition, the upstream components described in the first blog post make use of some of the custom abstractions that we built on top of Peloton. We adapted them to work on Kubernetes.
A resource pool is a logical abstraction for a subset of resources in a cluster. All resources in a cluster can be divided into hierarchical resource pools based on organizations and teams. A resource pool can contain hierarchical child resource pools to further divide the resources within an organization. Resource sharing among pools is elastic in nature—resource pools with high demand can borrow resources from other pools if they aren’t using those resources.
Every resource pool has different resource dimensions, such as those for CPUs, memory, disk size, and GPUs. We expect the number of resource dimensions to increase in the future as cluster management systems begin to support more types of resource isolation, such as Disk IO.
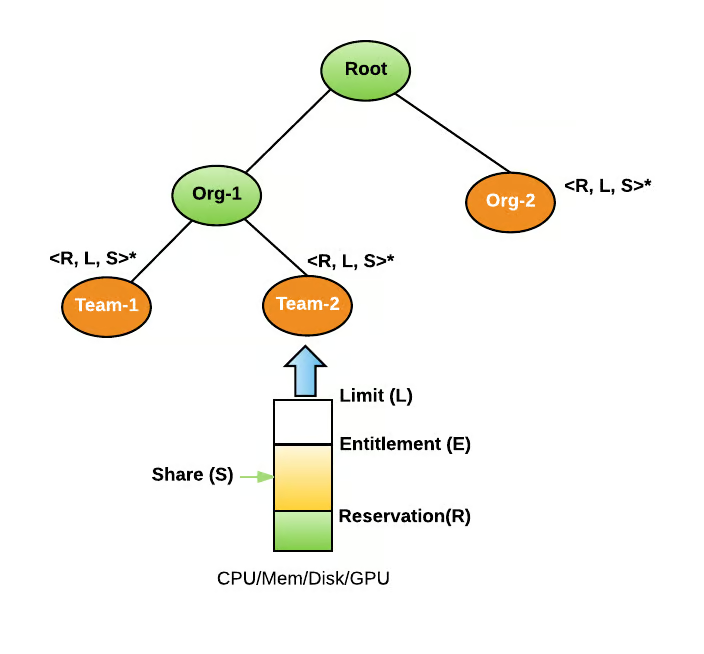
Figure 1: Hierarchical entitlement calculation.
Max-min fairness ensures that each resource pool (logical subsets of cluster resources allocated to teams) gets its fair share of resources. However, if a resource pool’s demand exceeds its reserved capacity, and other pools have unused resources, elastic sharing allows it to borrow resources. When these unused resources are required by the original owners, they can be preempted.
Advantages of elastic resource management include:
- Higher resource utilization. Elastic sharing maximizes resource usage, as no resources remain idle if other teams demand them. This helps clusters maintain high utilization rates, approaching 100% in peak demand periods.
- Cost savings on infrastructure. By sharing resources dynamically, teams need to purchase significantly fewer resources.
- Flexible workload management. Teams can prioritize their critical production workloads while borrowing resources for less critical, experimental pipelines when production demands are low. This flexibility ensures optimal use of guaranteed and opportunistic capacity.

Figure 2: Cluster allocation (orange) and demand (pink) plotted with the total cluster capacity (green).
Since Kubernetes doesn’t natively offer this type of dynamic preemption and resource sharing, we came up with our own solution to support elastic resource sharing in Kubernetes.

Figure 3: Elastic resource sharing in Kubernetes.
This architecture aims to extend Kubernetes with features of elastic resource sharing and preemption.
For resource pool management, the resource pools are defined as Kubernetes custom resources (CRDs), marking the resource pool configuration. Pods are assigned to resource pools by applying an annotation containing the pool name. This allows efficient grouping and management of resources within the cluster.
For resource accounting, the resource manager monitors all pod events to track demand and usage per resource pool. Demand is calculated as the sum of resource requests for pods waiting for admission. Usage is calculated from pods already admitted to the resource pool. Periodically, the resource manager sums the allocatable capacity of all cluster nodes (excluding nodes marked with maintenance taints) to determine the total cluster capacity. Entitlement is calculated periodically, based on current demand, usage, and total cluster capacity available.
We also introduced a custom scheduler called kube-resource-manager-scheduler for admission control. When a pod is created, its scheduler name is set to this scheduler. It places the pod in a priority queue. Once the pod passes admission control, the scheduler name is changed to default scheduler. The default scheduler then schedules the pod on a node. Pods that pass admission control but aren’t placed by the scheduler are killed after 25 minutes to free up resources. Pods with the scheduler name kube-resource-manager-scheduler are still pending admission, while all others are admitted.
If a resource pool exceeds its entitlement due to increased demand in other pools, pods are preempted to bring the pool’s usage in line with its new entitlement. The preemption algorithm is implemented in Kubernetes by using the eviction API. Preemptible pods are marked with the annotation preemptible: true. Non-preemptible pods can’t exceed their reservation. A pod condition is set before eviction to log the reason for preemption.
Pods are also labeled with gang metadata. A gang is a group of instances that’ll be scheduled together at once for a workload. During scheduling, the resource manager ensures that the entire gang’s demand can be satisfied by the assigned entitlement before admitting any of the Pods within the gang. In Kubernetes, gang scheduling relies on pod metadata. Pods part of the same gang are labeled with gang-member:
Pods are placed in a priority queue based on the priority field in their pod spec. This field directly determines their order in the queue for admission control.
We run a few training jobs on mixed hardware clusters. The Ray cluster is set up to have both GPU-enabled nodes and non-GPU nodes. Such clusters are optimized for resource utilization. This is achieved by offloading work that doesn’t require GPUs to CPU-only nodes. An example of such CPU-only work is data loading and shuffling in a machine learning training job. In a heterogeneous cluster, the loaded data is then fed to the GPU nodes to achieve high GPU utilization. Ray supports this out of the box by allowing the Ray nodes to be labeled as a data processing node or a GPU-enabled training node. It runs the Ray data loader on the data processing nodes to load and shuffle the data required for the training. This data is then fed to the nodes that are labeled as GPU-enabled training nodes.
To support running such heterogeneous training jobs, the underlying Kubernetes cluster is equipped with both CPU and GPU hosts in the same cluster. We developed a GPU filter plugin to filter out non-GPU pods and allow only the GPU pods to run on the GPU hosts.

Figure 4: Filter plugin for GPU pods.
The Kube scheduler distributes the non-GPU pods on the CPU nodes using the load-aware strategy to choose the least occupied CPU nodes. In the case of GPU workloads, we use a bin-packing scheduling strategy to efficiently use the GPU nodes and minimize fragmentation of the GPU hosts.
At Uber, we have a variety of Ray workloads. Some of these workloads require more powerful, newer-generation GPUs like the NVIDIA® H100. However, this new-generation hardware is expensive, so we only run a few specific workloads on it.
To effectively manage scheduling for special hardware requests in Kubernetes, we proposed an enhanced architecture that incorporates an SKU-based filtering mechanism. This approach ensures that workloads requesting specific GPU models are scheduled on the corresponding nodes, while general requests avoid these special resources.

Figure 5: SpecialResourceExclusionFilter plugin lifecycle.
Each GPU node in the cluster gets labeled with its model name. When submitting workloads, the pod specification includes a nodeSelector that matches the required GPU model from the list of supported special hardware (SKUs). For example, a pod requiring an NVIDIA H100 GPU will have a node selector gpu-node-label-model: NVIDIA_H100_80GB_HBM3 in its spec.
A list of supported special hardware is maintained at the cluster level, containing real model names, aliases, and configurations. This list is stored in etcd using a ConfigMap, and the Kubernetes scheduler and workload requestors have access to it.
For special hardware requests, the default Kubernetes scheduler ensures that pods are placed on nodes matching the nodeSelector specified in the pod spec. For general GPU requests, a new scheduling plugin, SKUExclusionFilter, filters out nodes that have special hardware, ensuring that these nodes are reserved exclusively for workloads requiring specific GPU models.
In a typical pod spec, general workloads can request GPUs without specifying a model. However, special workloads need to include the appropriate nodeSelector to ensure they’re scheduled on nodes with the requested GPU mod.
In Kubernetes, pods are launched through Containerd, a container runtime that manages the lifecycle of containers. Containerd emits various metrics related to the performance and resource usage of containers, which are crucial for monitoring and optimizing workloads.
For CPU metrics, Containerd tracks CPU usage per container, providing data like the total CPU time consumed and CPU throttling.
Memory usage metrics include total memory used, memory limits, and memory failures (like out-of-memory events). These metrics help monitor container memory consumption, ensuring workloads don’t exceed their memory allocations and trigger crashes or performance degradation.
For GPU-accelerated workloads, Ccontainerd can expose GPU usage metrics if supported by the underlying hardware and drivers. This includes GPU memory utilization, GPU processing time, and other relevant statistics, helping to optimize and track GPU-bound tasks.
The pod container metrics are aggregated over a workload level and reported on Grafana® dashboards. To gather pod metrics, we use a daemon agent to collect resource utilization metrics of containers running on a machine. The daemon agent uses cAdvisor as a library to gather metrics and enhance them with Uber-specific labels, like the Ray job ID to all its head and worker containers to aggregate over the job level. A central collector service collects these metrics.

Figure 6: Container Utilization Metrics of a Pod.
Elastic resource management, heterogeneous clusters, and GPU-specific workload scheduling have been critical to Uber’s machine learning pipeline orchestration on Kubernetes. These enhancements help Uber run its machine learning workloads efficiently and reliably. As a next step, we’re considering open-sourcing the technologies described in this blog series.
Apache®, Apache Spark™, Apache Hive™, Apache Mesos, Apache Helix, and the star logo are either registered trademarks or trademarks of the Apache Software Foundation in the United States and/or other countries. No endorsement by The Apache Software Foundation is implied by the use of these marks.
The Grafana Labs® Marks are trademarks of Grafana Labs, and are used with Grafana Labs’ permission. We are not affiliated with, endorsed or sponsored by Grafana Labs or its affiliates.
Kubernetes® and its logo are registered trademarks of The Linux Foundation® in the United States and other countries. No endorsement by The Linux Foundation is implied by the use of these marks.
NVIDIA®, the NVIDIA logo, CUDA, DGX, HGX, HGX H100, NVLink, NVSwitch, OpenACC, TensorRT, and Volta are trademarks and/or registered trademarks of NVIDIA Corporation in the U.S. and other countries.