重建图形以提高可访问性:深入了解可汗学院的包容性设计
By Cat Johnson, CPWA & Senior Frontend Engineer
At Khan Academy, our mission is to “provide a free, world-class education for anyone, anywhere.” This commitment shines through in our dedication to accessibility and ensuring that all learners, regardless of ability, can access our library of content. But did you know that until recently, learners who depended on a screen reader could not use our interactive graphs? As such, we renewed our commitment to our mission by improving the accessibility of our graphing exercises.
在可汗学院,我们的使命是“为任何人、任何地方提供免费的世界级教育。”这一承诺体现在我们对可及性的奉献上,确保所有学习者,无论能力如何,都能访问我们的内容库。但你知道吗,直到最近,依赖屏幕阅读器的学习者无法使用我们的互动图表?因此,我们通过改善图形练习的可及性,重新承诺我们的使命。
You might be asking, “How do you make a graph accessible?” We’re glad you asked! Let us take you on a journey through how we created accessible graphs that work for everyone.
您可能会问,“如何使图表可访问?”我们很高兴您问了这个问题!让我们带您走过我们如何创建适合每个人的可访问图表的旅程。
Why graph accessibility matters (and where we started)
为什么图形可访问性很重要(以及我们从哪里开始)
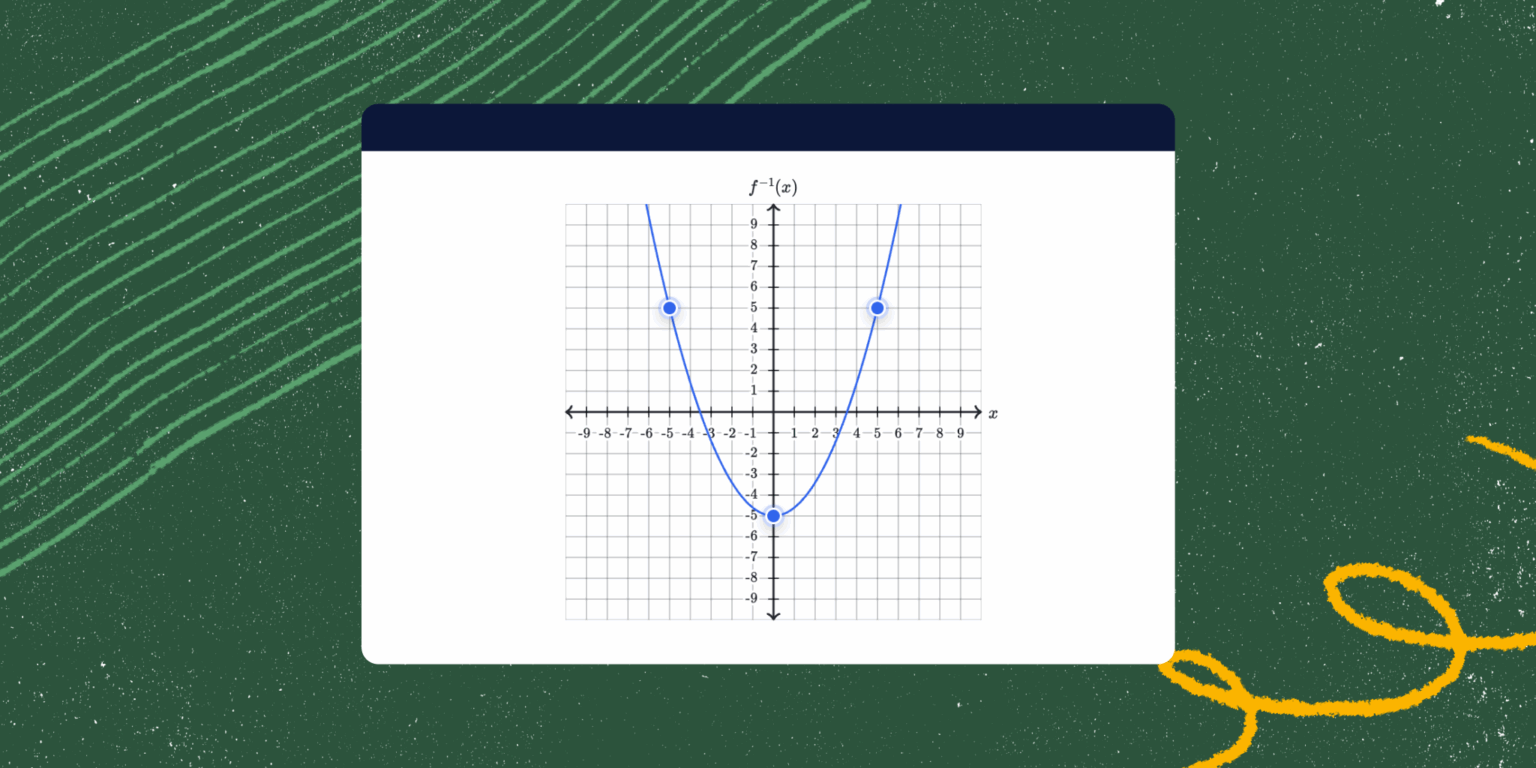
Our initial graphing exercises were based on a very old version of Raphael.js, which is an API that can draw 2D images using SVG. From there, we added a layer of interactive elements that students could drag to complete practice exercises. While this worked well for many students using a mouse, it posed challenges for those relying on keyboards or assistive devices. This meant many students could not complete our exercises without depending on someone else.
我们最初的图表练习基于一个非常旧版本的 Raphael.js,这是一个可以使用 SVG 绘制 2D 图像的 API。从那里,我们添加了一层学生可以拖动以完成练习的交互式元素。虽然这对许多使用鼠标的学生来说效果很好,但对依赖键盘或辅助设备的学生来说却带来了挑战。这意味着许多学生无法在不依赖他人的情况下完成我们的练习。
As a result, we set out to make our graphs:
因此,我们着手使我们的图表:
- Visually accessible: We enhanced color contrast to ensure graphs are easily distinguishable and accessible for students with visual impairments or color blindness.
- 视觉可及:我们增强了颜色对比度,以确保图表对视觉障碍或色盲的学生易于区分和访问。
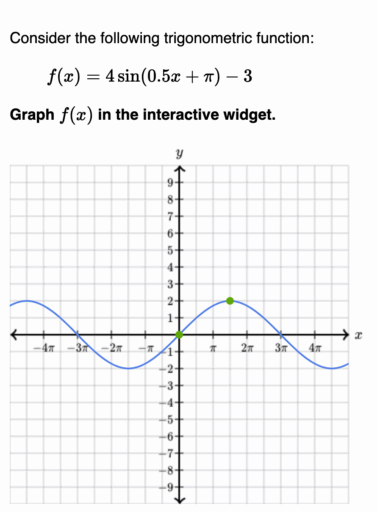
- Keyboard accessible: This allows students to use their keyboard to move points and update graphs to answer questions.
- 键盘可及:这允许学生使用键盘移动点并更新图表以回答问题。
- Scr...