Metric Semantic Layer: How Lyft Governs and Scales Key Data Definitions
[
Lyft Engineering
](https://eng.lyft.com/?source=post_page---publication_nav-25cd379abb8-56bee3643c29---------------------------------------)
[

](https://eng.lyft.com/?source=post_page---post_publication_sidebar-25cd379abb8-56bee3643c29---------------------------------------)
Stories from Lyft Engineering.

Written by Rohit Channe and Simran Mirchandani at Lyft.
Motivation
At Lyft, data isn’t just a resource — it’s woven into everything we do. Metrics drive key forecasts, steer operational decisions, and put our boldest hypotheses to the test. But as Lyft scaled, products launched and evolved, and team members came and went, we found ourselves at risk of different teams using different definitions for a given metric. What did “Metric ABC” actually mean? The answer often depended on the context and application of the team you asked.
The consequences were predictable. Without centralized version control or a shared standard, outdated metric definitions crept into decision-making.
Our solution was to build an internal Metric Semantic Layer (MSL): a centralized repository that serves as a single, authoritative home for every metric’s definition — providing both a clear, plain-English description and the definitive SQL code. No more hunting across codebases or tribal knowledge — just one place to store and access a standardized, agreed-upon definition. With MSL, we have a single source of truth — consistent terminology and assumptions across every team, so everyone is genuinely speaking the same language. We achieve this through three key principles:
- Simplified onboarding and change management — update a metric definition once, and the change automatically and frictionlessly flows through every downstream application that depends on it
- Intentional governance — clarified ownership, defined scope, clear accountability for data quality, and a structure resilient enough to survive org changes, team rotations, and attrition
- Transparency and accessibility — definitions are easy for both technical and non-technical users (and downstream applications) to find and integrate into day-to-day workflows
Solution
Taking the above principles into account, we implemented the Metrics Semantic Layer as a Python package:
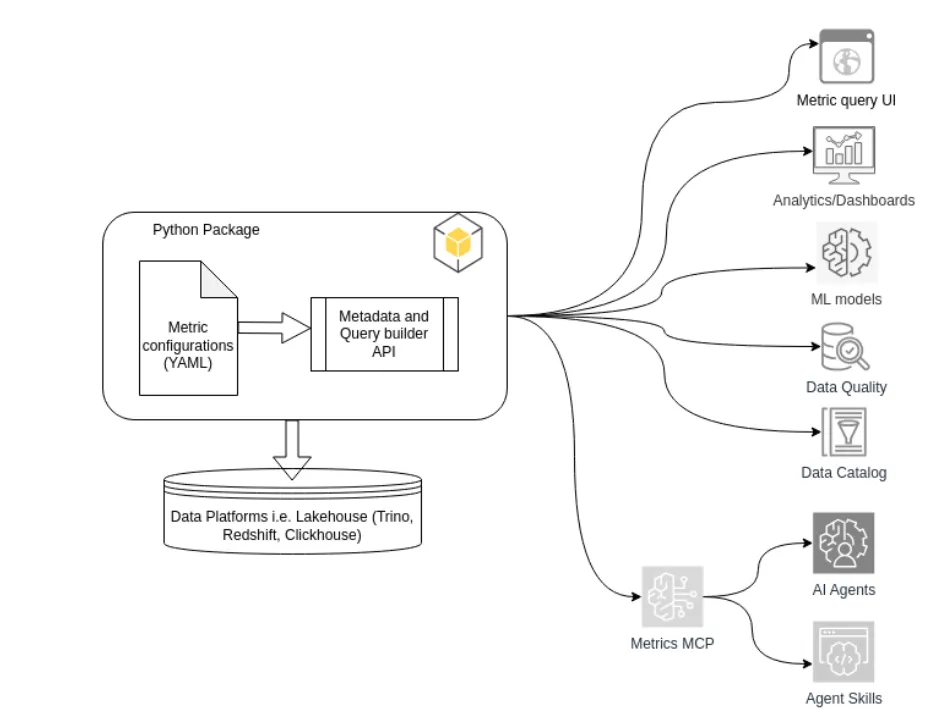
1 — Simplified onboarding and change management through flexible metric configurations
To codify the business logic and metric definitions along with supporting metadata attributes, we used YAML configurations. YAML representation provides both flexibility in — and readability of — the metric definition. The core definition is stored in the SQL jinja templates, which gives us optionality to tailor the final SQL based on time granularity and dimensions. Jinja templates were specifically chosen to make sure the SQL blocks are not redundantly declared across multiple definitions (DRY methodology) and also have a lower learning curve compared to some of the other templating frameworks.
YAML example
operational_owner: rides_table_owners
data_sources:
  - rides_table
view: |
  SELECT DATE_TRUNC('{{time_granularity}}',{{time_attribute}}) AS {{time_granularity}},
  {{select_dimensions(dimensions)}},
  {{select_metrics(metrics, include_ratio_parts)}}
    FROM rides_table
   WHERE {{time_attribute}} BETWEEN DATE('{{start_date}}') AND DATE('{{end_date}}')
  {% macro groupby_dimensions %}
time_attribute: ds
time_granularity:
 - day
 - week
 - month
dimensions:
  - dimension_name: region
    dimension_expression: ride_region
    dimension_definition: Ride region

metric:
  - metric_name: rides_completed
    metric_description: Rides with drop off completed
    metric_type: Additive
    business_owner: rides_owner
    aggregated_expression: 1.0*count_if(is_dropped_off)
2 — Intentional governance to enable scale
In order for the package to continue to be effective in the long term, we had to define structure around ongoing governance. We have done this via two primary mechanisms:
- Selection criteria: What metrics (and when relevant, dimensions) warrant being included in the package?
- Ownership model: How do we make sure metrics remain up to date? Who bears the responsibility of maintaining the definitions?
Selection Criteria
Not all metrics are created equal. There are some that are unique to one team, whereas others are of interest to people across the company. This latter group is considered “Golden Metrics”. These are metrics that have at least two distinct use cases or applications. These are the metrics that are allowed to be onboarded onto the package; anything too niche creates more overhead than it’s worth. For example, Rides Completed is actively monitored via key dashboards and also leveraged in operational ML models.
Ownership Model
All Golden Metrics are required to have a Business Owner and an Operational Owner. An owner should never be an individual — but rather a team — in order to be as resilient as possible.
Get Iraklikhorguani’s stories in your inbox
Join Medium for free to get updates from this writer.
Business Owner: They are responsible for metric health.
- Who?
- A Data Analyst or Data Scientist with deep understanding of the business, market conditions, and normal levels of volatility. - What?
- Provide (both written and technical SQL) definitions of the metric.
- Maintain the definition in the package by verifying the existing definition or updating it on a regular, pre-defined cadence.
- Define the limitations and scalability of the metrics (e.g. allowed dimensions and time granularities). Gather approval from stakeholders.
Operational Owner: They are responsible for data health.
- Who?
- A Data Engineer or Data Scientist with experience creating/supporting ETL pipelines. - What?
- Ensure quality of the underlying data tables used by providing on-call support, creating and maintaining data quality (DQ) checks, and running backfills to fix issues if needed.
- Communicate delays or issues with the production of the metric, changes to the underlying assumptions/logic, and data changes due to backfills.
All changes to a metric’s definition must be approved by both the Business and Operational Owners. This requirement serves two key purposes:
- Informed and Coordinated Action: It ensures all relevant parties are aware of the change and can make necessary, reactive adjustments. For example, the Operational Owner might need to establish new DQ checks following a business definition update to maintain trust in a metric.
- Accountability and Quality Control: This shared responsibility utilizes the distinct knowledge of each party. One owner may be aware of critical nuances that the other is not, thereby preventing the adoption of a suboptimal change.
3 — Achieving transparency through access methods and APIs
The configurations are now exposed through Python-based methods and APIs. This module helps users explore what metrics are defined, fetch their metadata and, most importantly, get or execute the SQL definition. This also serves as an interface for integration with analytics dashboards, data quality tools, data orchestration (Airflow), ML models/workflows, and AI agents/tools. The Python package is versioned and updates are deployed periodically to all dependent applications through automated code refactors so that they receive the latest updates.
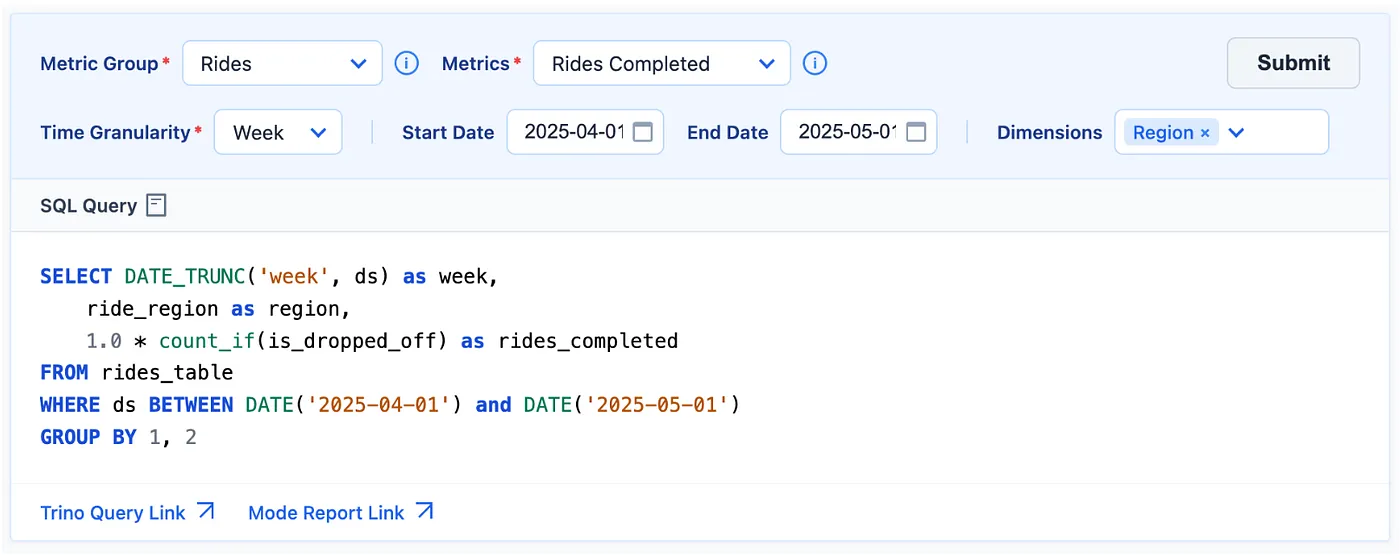
### Input
from metrics_source import get_sql
print(get_sql(metric_group_name='rides',
              start_date='2025-04-01',
              end_date='2025-05-01',
              dimension_names=['region'],
              metric_names=['rides_completed'],
              time_granularity='week',))

### Output
SELECT DATE_TRUNC('week',ds) as week,
ride_region as region,
1.0*count_if(is_dropped_off) as rides_completed
  FROM rides_table
 WHERE ds BETWEEN DATE('2025-04-01') and DATE('2025-05-01')
 GROUP BY 1,2
Accessing Standardized Metrics
Here are some ways we’ve enabled users to access MSL without directly using the Python access functions.
Amundsen: Discoverability
For users who want to discover, explore and access metric definitions, we integrated with our internal data catalog tool Amundsen. This helps them search, navigate to, and access metric definitions, while also surfacing ownership and data quality information.
Self-Service Tooling
For users who wish to generate and execute a custom metric SQL without writing any code, we have introduced a self-service Metric UI. This tool allows users to select the necessary dimensions and time grains to generate SQL tailored to their specific use case, while preserving the core metric definition constructs and predicates.
AI MCP/Skills
One of the biggest, and perhaps most unexpected, benefits of structuring our metrics definitions in clean, accessible YAML files — making them entirely code-friendly — is that this configuration serves as a comprehensive knowledge base for AI Agents and Skills.
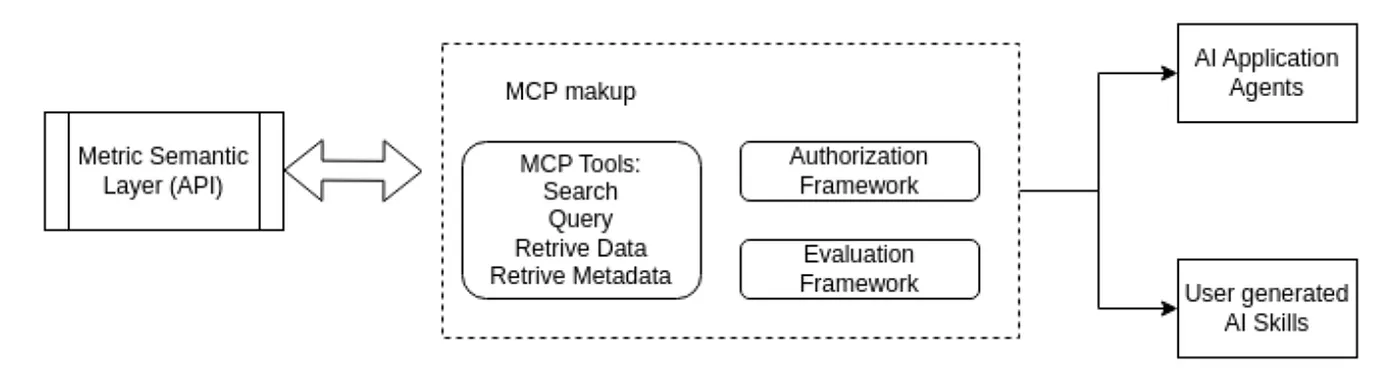
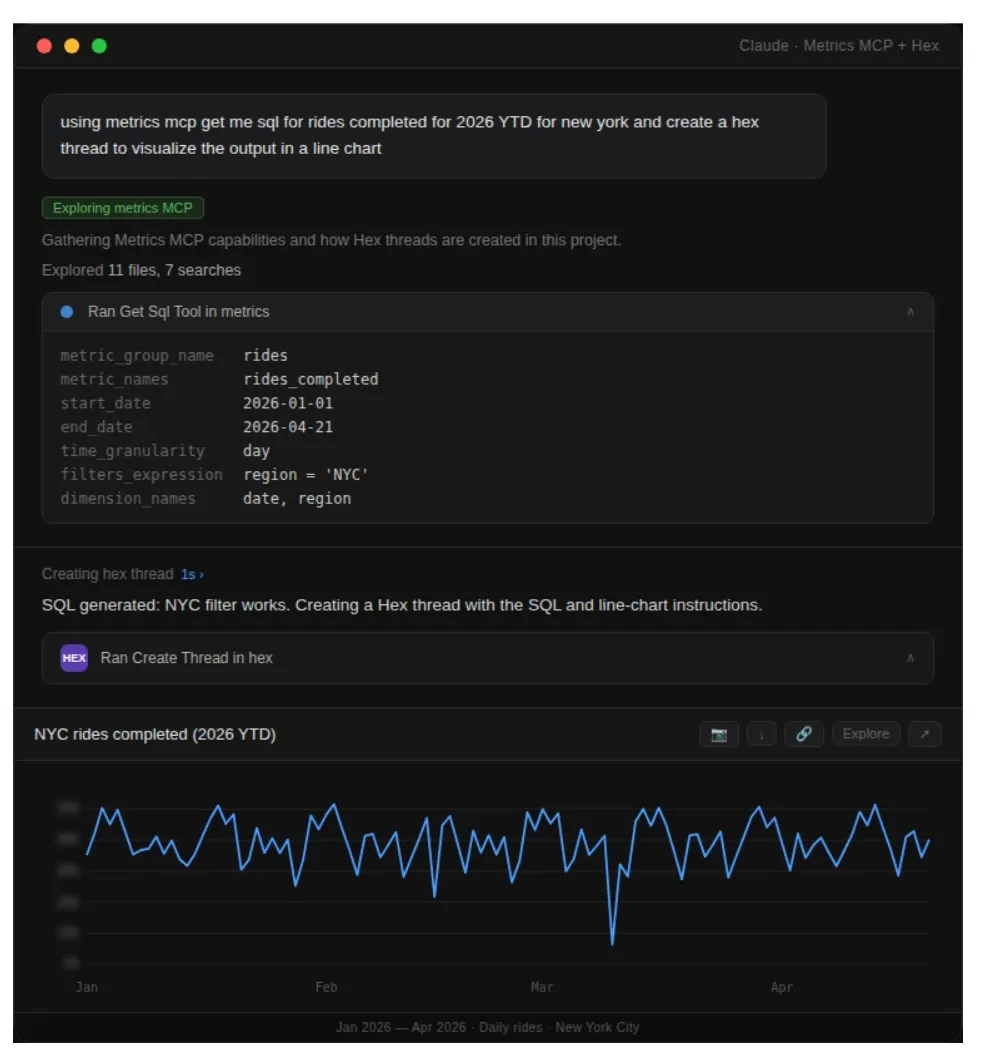
We created an MCP (Model Context Protocol) with tools to access the MSL library and lets users ask natural-language questions about metrics, with greater accuracy and fewer hallucinations. Users can integrate the MCP with Skills and Custom AI Agents in their local or remote workflows in Claude and Cursor. It also integrates well with popular BI tools like Hex, making the AI generated outputs from these BI tools more reliable.
Lastly, there are also guardrails baked in for evaluation of the results from the MCP using evaluation techniques like ground truth and LLM as a judge.
Next Steps
The homegrown solution MSL has served as a great foundation for making sure key business applications are aligned to the latest metric definitions. Beyond that, it brought rigor in metric change management. However, as we expand our scope and seek to integrate with other third-party applications (BI tools and Databases), we are exploring options for a vendor managed solution. This will naturally extend the Metric Semantic Layer to AI-driven analysis. The deterministic structure and construct of the metric configuration and accessibility tools serve as baseline context and knowledge base for generating AI-assisted business insights we are building at Lyft — more to come on this in a follow-up blog post!
Acknowledgements
This work would not have been possible without contribution from many teams across the company. We want to especially shout out the following people (in no particular order) for their foundational thinking and architecture contributions: Caitlin Wormsley Andrew Chan Santiago Martinez Vara Ortiz Vladyslav Zherebkin Yunyi Xie Kristen Armes Devon Mittow
Responses (2)Write a response
[
What are your thoughts?
](https://medium.com/m/signin?operation=register&redirect=https%3A%2F%2Feng.lyft.com%2Fmetric-semantic-layer-how-lyft-governs-and-scales-key-data-definitions-56bee3643c29&source=---post_responses--56bee3643c29---------------------respond_sidebar------------------)
Governing data definitions as code is a powerful shift, but the real challenge is often the organizational friction involved in aligning stakeholders on those definitions. Decoupling metrics from the underlying infrastructure allows teams to innovate without breaking the downstream reporting layer.
[
](https://medium.com/m/signin?actionUrl=https%3A%2F%2Fmedium.com%2F_%2Fvote%2Fp%2Ffb8b6f65c00e&operation=register&redirect=https%3A%2F%2Fmedium.com%2F%40olha_zverieva%2Fgoverning-data-definitions-as-code-is-a-powerful-shift-but-the-real-challenge-is-often-the-fb8b6f65c00e&user=Olha+Zverieva&userId=2b902c1edb40&source=---post_responses--fb8b6f65c00e----0-----------------respond_sidebar------------------)
Great read! Using a central library to manage the semantic layer across various downstream apps sounds like a strong foundation step. Curios why you decided to implement internally and not explore vendor managed solutions (dbt metric flow or cube etc.) to start with.
[
](https://medium.com/m/signin?actionUrl=https%3A%2F%2Fmedium.com%2F_%2Fvote%2Fp%2F00eb13563f41&operation=register&redirect=https%3A%2F%2Fmedium.com%2F%40rajraomusings%2Fgreat-read-00eb13563f41&user=Raj+Rao&userId=3590f5c3bf0d&source=---post_responses--00eb13563f41----1-----------------respond_sidebar------------------)