使用 OpenTelemetry 和 vmagent 构建高吞吐量指标管道
A production-tested approach for moving a large-scale metrics pipeline from StatsD to OpenTelemetry and Prometheus.
一种生产验证的方法,用于将大规模指标管道从 StatsD 迁移到 OpenTelemetry 和 Prometheus。

Colorful vintage mugs filled with small flowers hang in rows on a chain-link fence, creating a vertical garden.
色彩缤纷的复古马克杯,里面装满小花,以行排列挂在链式围栏上,形成一个垂直花园。
By: Eugene Ma, Natasha Aleksandrova
作者: Eugene Ma,Natasha Aleksandrova
When migrating to a new monitoring system, you’ll want to frontload the work to collect all your metrics. This exposes bottlenecks at full write scale and unblocks the migration of assets which require real data for validation, such as dashboards and alerts. Collecting all your metrics first means you can focus on major technical challenges — scale, correctness and performance — without worrying about how users will adopt your new tools.
在迁移到新监控系统时,你会想要提前完成收集所有指标的工作。这会在全写规模下暴露瓶颈,并解除需要真实数据进行验证的资产(如仪表板和警报)的迁移阻塞。先收集所有指标意味着你可以专注于主要的技术挑战——规模、正确性和性能——而不用担心用户如何采用你的新工具。
But for our project, this approach wasn’t straightforward: most of our metrics were instrumented with StatsD libraries, OpenTelemetry was gaining traction, and our new storage system was based on Prometheus. We were left with a lot of open questions. Where do we fork the metrics? Should we adopt OpenTelemetry? Do our metrics work well with Prometheus? The task of collecting metrics required us to answer these questions and rethink our metrics infrastructure.
但对于我们的项目,这种方法并不直接:我们的大多数 metrics 都是使用 StatsD 库 instrumented 的,OpenTelemetry 正在获得 traction,我们的新存储系统基于 Prometheus。我们留下了很多开放问题。我们在哪里 fork metrics?我们应该采用 OpenTelemetry 吗?我们的 metrics 与 Prometheus 兼容良好吗?收集 metrics 的任务要求我们回答这些问题并重新思考我们的 metrics 基础设施。
Instrumentation and collection
插桩和收集
Our services originally used the StatsD protocol, with a Veneur sidecar collecting and forwarding metrics to our vendor.
我们的服务最初使用 StatsD 协议,通过 Veneur sidecar 收集并转发指标到我们的 vendor。
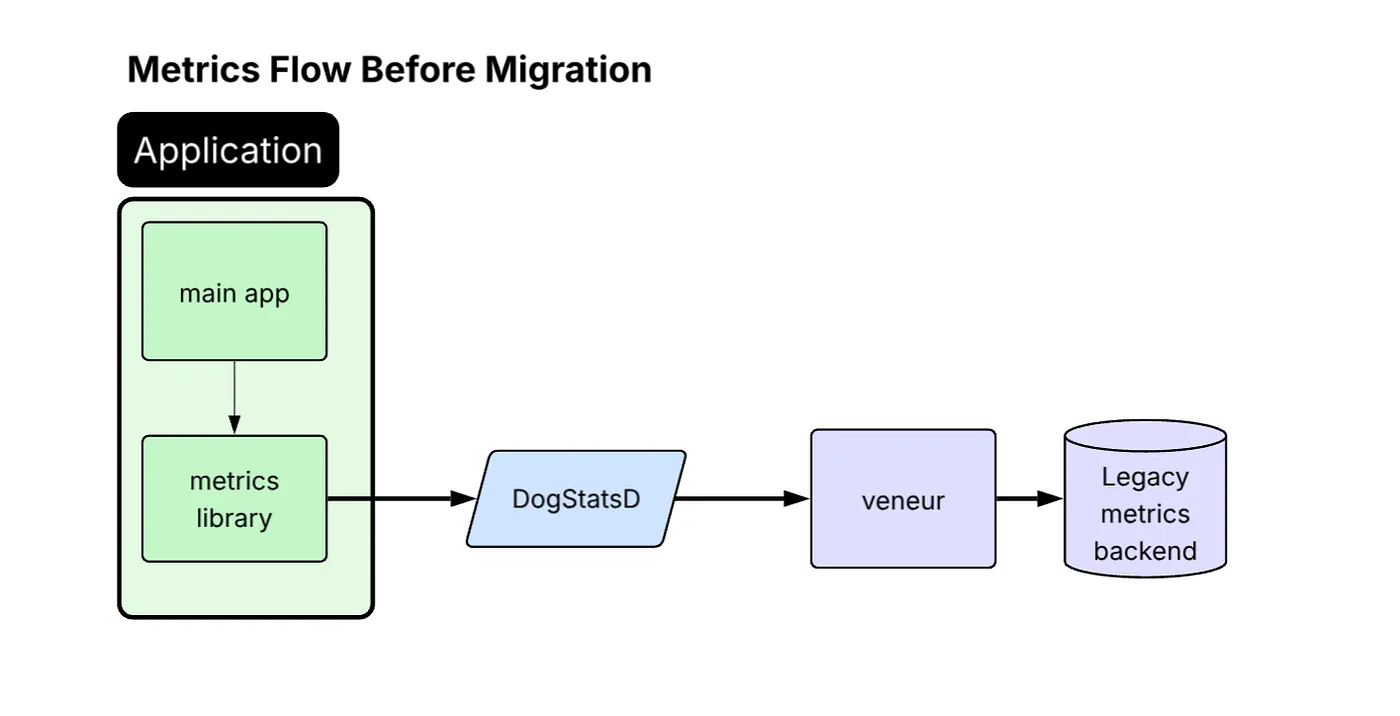
Diagram titled “Metrics Flow Before Migration.” Inside a green “Application” block, the “main app” feeds data to a “metrics library,” which sends metrics to a...