Drastically Reducing Out-of-Memory Errors in Apache Spark at Pinterest
[
Felix Loesing | Software Engineer
In 2025, we set out to drastically reduce out-of-memory errors (OOMs) and cut resource usage in our Spark applications by automatically identifying tasks with higher memory demands and retrying them on larger executors with a feature we call Auto Memory Retries.
Spark Platform
Pinterest runs a large-scale Apache Spark deployment to satisfy the increasing demands of internal customers, such as AI/ML, experimentation, and reporting. We process 90k+ Spark jobs daily on tens of thousands of compute nodes with hundreds of PB in shuffle size.¹ Our clusters are run on Kubernetes and mainly use Spark 3.2, with an upgrade to Spark 3.5 in progress. We use Apache Celeborn as our shuffle service, Apache Yunikorn as our scheduler, accelerate computation with Apache Gluten & Meta’s Velox, and use our in-house submission service called Archer. Check out this blogpost to learn more about our data infrastructure here.
Problem Identification
Historically, we knew that OOM errors were frequent in our clusters due to small executor sizes. Increasing them is not as easy as our clusters are memory bound, meaning that the core to memory ratio of our jobs is higher than that of the physical hardware. Our main approach to get our jobs’ memory ratio closer to the hardware is to continuously auto-tune jobs by reducing their executor memory configurations to match historic job usage. Reaching out to owners of our most expensive jobs to manually tune configurations, including memory, to reduce cost, resulted in only limited success due to priorities of product teams.
Manually tuning jobs can be very effective, but it takes a lot of experience and time to perform these improvements by finding configurations that work for every stage and task of the job. Different stages perform different operations, so they are inherently unrelated and even tasks within a stage can have quite different resource requirements due to skew in the data they process. This is why we decided to make executor sizing elastic by automatically launching larger executors for tasks that failed with OOM previously. This is powerful because application memory configurations do not need to be tuned for the maximum requirement, but can be tuned for the P90 memory usage. Few tasks requiring more are automatically retried on larger executors, but most tasks run well on smaller executors. We landed on this approach as it is not possible to accurately predict the required memory of a task before it runs.
In our analysis, we found that over 4.6% of job failures are caused by OOM errors, which at our scale, is a significant number of jobs.² Investigating these jobs revealed that they use a substantial amount of compute, create on-call load for customer teams, and delay downstream jobs. Through this insight, we set our goal to significantly reduce the resources consumed by OOM failed jobs to justify the engineering effort.
**Executor Memory in Apache Spark
**In Apache Spark, each executor has a certain amount of memory and CPU cores based on the configuration set by the user. The default behavior in Apache Spark is that each core creates a slot for a task to be scheduled (except if you set spark.task.cpus=2 or higher), so in our example below, 2 tasks run concurrently on this executor. Here, the user configured 8GB of memory, so this averages to 8GB / 2 tasks = 4GB per task. Note that memory is shared between tasks, so one task could temporarily use 4.5GB if the other task uses 3.5GB or less. Only if the summed up memory usage of all tasks exceeds the total, then we see an OOM error.
Press enter or click to view image in full size
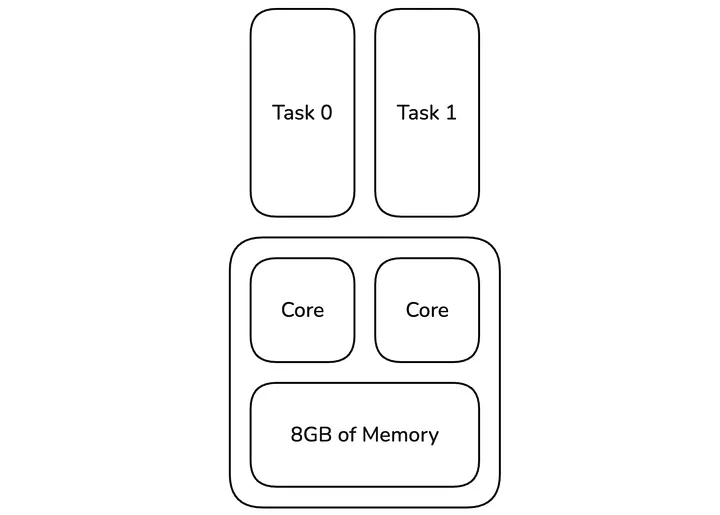
Figure 1: Two tasks running on one executor
We are not the only company that worked on automatically responding to OOM errors, as Uber explained a similar concept that they implemented internally in a blogpost. However, from what we can find publicly, we wanted to take this further by also launching physically larger executors, have increasingly larger profiles for each retry, and adding a proactive approach, which we will detail towards the end.
Overall, we wanted to achieve two things: reduce on-call load and reduce costs due to fewer failing applications that take up resources.
High level design
Press enter or click to view image in full size
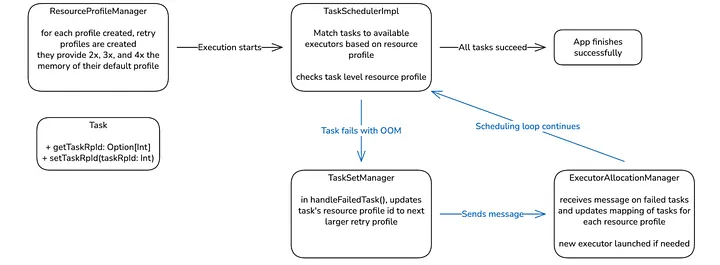
Figure 2: Updated Scheduling Diagram
This is the high-level diagram of the updated scheduling loop (blue arrows) in our custom Apache Spark version. The primary goal is to introduce a resource profile at the task level so that individual tasks can be retried with a larger memory profile.
In a standard Apache Spark application, all tasks within a TaskSet share the same resource profile. Our approach enables deviation from this standard by storing an optional task resource profile ID (taskRpId) in the Task object if it deviates from the TaskSet’s resource profile.
We increase the memory available to a task in a hybrid strategy, combining two methods to resolve Out-Of-Memory (OOM) errors while maintaining performance:
- Increase CPU Property (if executor has > 1 cores): If an OOM occurs, the first retry doubles the cpus per task property. This is a fast and cheap step that allows the task to run on an existing, default executor while sharing the memory with fewer tasks.
- Launch Larger Executor: If the OOM persists (e.g., the task needs more memory or shared off-heap memory is insufficient), we launch a new, physically larger executor while keeping the increased CPU property. This is also done when a single task already takes up the full executor.
We create immutable retry resource profiles (2x, 3x, and 4x) when the base profile is registered, which are then used sequentially for retries. These sizes result from the natural increase of the cpus property in the task resource profile and we continue these scaling factors in executor memory increases for consistency. If off-heap memory is enabled, as done in our workloads accelerated with Apache Gluten, we also double the off-heap memory.
Press enter or click to view image in full size
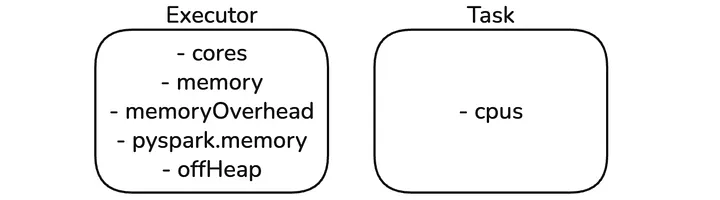
Figure 3: Resource Profile built-in properties
This logic required extending the following core Apache Spark classes:
-
Task: Updated to hold the optional taskRpId value to indicate a deviation from its parent TaskSet’s resource profile.
-
TaskSetManager: • Keeps an index of tasks with deviating profiles for fast access during scheduling.
• Automatically assigns the next larger retry profile when an OOM failure is detected.
-
TaskSchedulerImpl: Decides which resource profile to schedule for an available executor. It is modified to allow tasks with an increased CPU property to run on default executors, which prioritizes reusing existing resources for speed.
-
ExecutorAllocationManager: Tracks the number of pending tasks for each retry profile and launches new, physically larger executors when required to accommodate tasks that need more physical memory.
We considered a Spark listener approach, but decided to instead create Pinterest-specific classes that inherit from the original Apache Spark classes and only override the necessary functions. This allows for a safe implementation where the Auto Memory Retries specific classes are only loaded when the feature is enabled, while giving us finer control over task scheduling than a Spark listener approach.
As a quality of life improvement for our users, we updated the SparkUI to show the task resource profile id in the task list for each stage.
Press enter or click to view image in full size
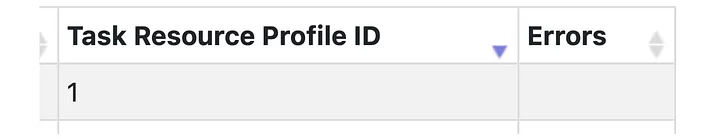
Figure 4: Updated Apache SparkUI
Task Memory Explanation
Press enter or click to view image in full size
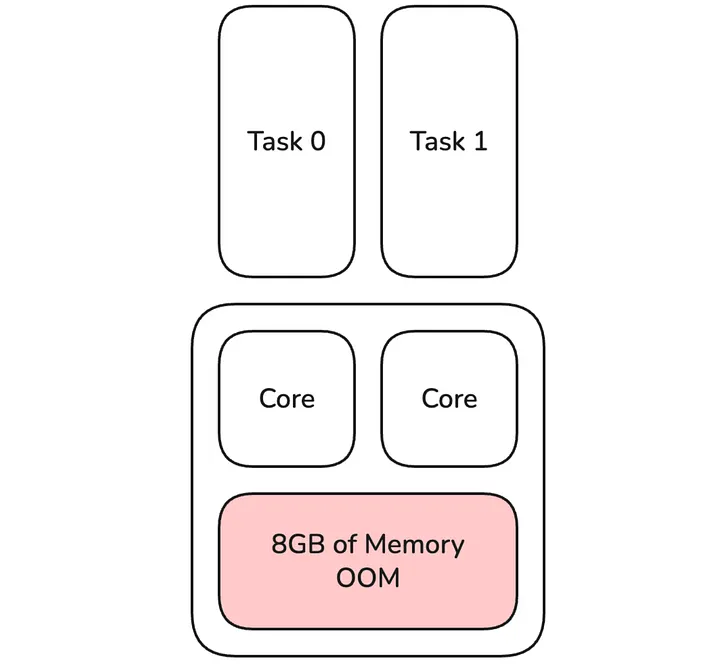
Figure 5: Default Executor with OOM caused by tasks 0 & 1
Once a task fails with an OOM error and the executor has more than 1 core, the first operation we do is double the cpus per task property for tasks that failed. Other tasks in the stage or future stages are not affected by this step. In Apache Spark, it is hard to quickly identify which of the tasks running on the executor caused the OOM error by using the most memory. Instead, we treat all tasks on the terminated executor as OOM failed. In this example, this means that both tasks 0 & 1 do not share an executor with any task on their first retry, and each of them is routed to the first available executor. This doubles the memory available to these tasks (full 8GB available) and this is an effective first step, as this operation is cheap and fast. It does not require a larger executor to be launched; we can reuse ones with the default profile that are already up. Especially for short running tasks, the cost of occupying 2 task slots temporarily is minimal compared to a single slot. This only works if the doubled cpus per task property is still smaller than or equal to the total cores of the executor. Otherwise, an executor with a larger memory configuration is launched.
Press enter or click to view image in full size
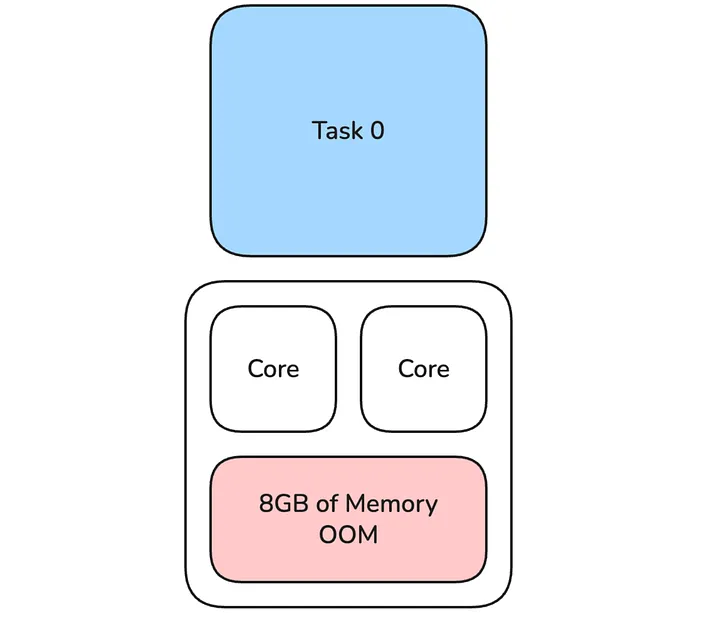
Figure 6: Task 0 uses both cores of the executor
In most cases, doubling cpus per task for only failed tasks within their stage resolves the OOM error. In cases where it does not, for example, if the task needs more than double the memory or the amount of shared off-heap memory for Netty shuffle buffers is too small, we launch a bigger executor while keeping cpus per task at the increased level. In this case, for the second retry, there is one task using 12GB of memory which is 3x the memory available to that task during the initial run (4GB).
Press enter or click to view image in full size
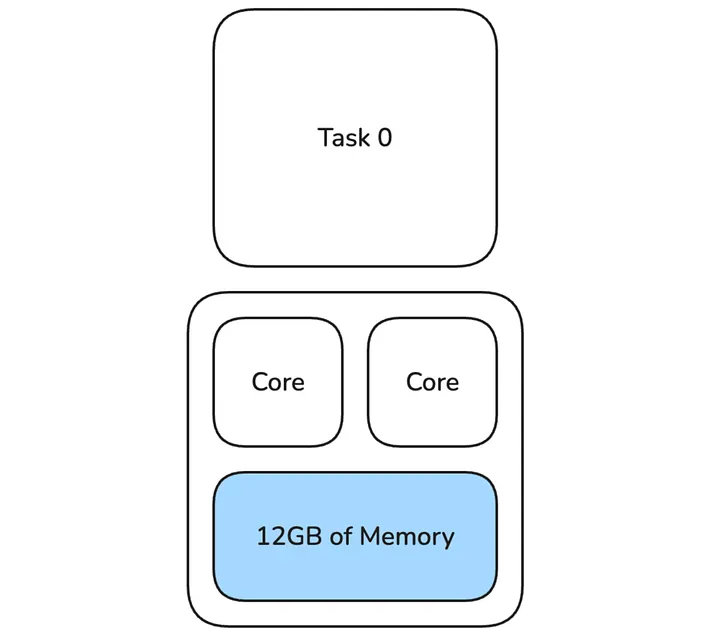
Figure 7: Task 0 uses larger executor with 12GB of memory
Implementation
**Task
**As briefly described above, the Task class has been updated to hold an optional taskRpId value that indicates the resource profile for that task. This value is updated when the task fails with an OOM error. An empty value indicates that it uses the resource profile of its parent TaskSet.
**ResourceProfileManager
**When a new resource profile is registered, we automatically create the corresponding retry profiles (2x, 3x, and 4x) for it. These profiles increase the memory, memoryOverhead, and, if set, off-heap memory based on the scaling factor. A mapping is kept from the original resource profile id to all ids of the retry profiles for fast access.
**TaskSetManager
**On task failure, in handleFailedTask(), it checks if the failure reason is an OOM error, and if so, it assigns a retry profile or increases it to the next larger retry profile. The other update is to keep track of the indexes of tasks for each retry profile. If TaskSchedulerImpl decides to schedule a certain retry profile, a task for that profile can quickly be dequeued and launched.
**TaskSchedulerImpl
**TaskSchedulerImpl is modified to check what resource profiles are currently active in the stage (kept by TaskSetManager), and it will decide which one to run for each worker offer. This change is needed as, for profiles where cpus per task property is increased, we can place them on executors with the default profile even though the task’s resource profile and the executor’s profile do not match. We do that as it is faster to reuse executors that are already running.
**ExecutorAllocationManager
**We need to update the executor allocation logic so that matching executors are launched when required due to pending tasks with retry profiles. We do that by keeping track of an offset for each resource profile id. When a task fails, and the resource profile id is updated, the ExecutorAllocationManager is notified in a message. Then, we increase the number of tasks for that retry profile id by 1 and decrease it by one for the default resource profile id. The map would look like this:
{0 -> -1, 1 -> 1} and we can use it to easily calculate the number of pending tasks for each resource profile.
Rollout & Monitoring
We rolled out the feature in multiple stages that we ramped up over time while monitoring metrics. We build a dashboard that measures the following:
- Cost saved due to recovered jobs
- Number of jobs recovered
- MB seconds saved
- Vcore seconds saved
- Number of jobs that failed after retry
- Number of jobs that failed with OOM after retry
We started slowly, ramping ad hoc user submissions from 0% to 100%, followed by scheduled jobs. Our scheduled jobs are tiered and we started with our lowest Tier 3 jobs, followed by Tier 2, and lastly Tier 1. This staged rollout allowed us to monitor issues and make the feature more robust before being applied to our more critical jobs. It is very important to make sure that this feature is a net positive for our platform by making sure that we prevent any metric regressions while simultaneously decreasing both the OOM failure rate and cost.
Results
After the successful rollout, we saw a very significant drop of 96% in OOM failures across all our jobs. [1] This change substantially improved our platform by reducing the on-call workload and delay of downstream jobs, and freed resources that supported the organic growth of our platform without incurring additional costs.
This result validated our initial problem observation and justified the large engineering investment of creating, testing, and rolling out this feature to tens of thousands of daily jobs. We are investigating how we can further decrease job failures related to OOM errors by investigating increases larger than 4x and prioritizing an increase in executor memory over cpus per task if we suspect the cause is off-heap memory.
Press enter or click to view image in full size
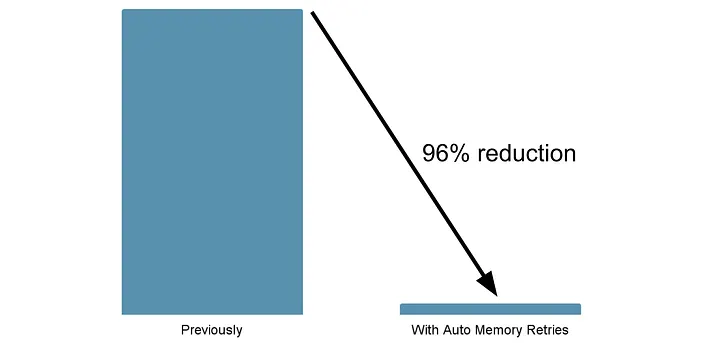
Figure 8: Reduction of jobs failed with OOM error
Learnings
**Scheduler Performance
**We occasionally observed a delay in task scheduling for very large TaskSets (400k+ tasks) due to the need to iterate over the list of tasks to determine what retry profiles have active tasks and to find them in the list of all tasks for scheduling. We fixed this issue by creating an index that allows for quick access to tasks with resource profiles.
**Creating resource profiles based on profiles registered for Apache Gluten compatibility
**In the beginning, we created resource profiles based on the configuration passed into the job but we realized it had two limitations:
- Our custom Apache Gluten registers resource profiles after application startup and we need to create retry profiles for these as well.
- If Scala/PySpark users register custom resource profiles in their job, we need to create retry profiles for these as well.
So we changed it to create the retry profiles when a new profile is created in addResourceProfile().
**Hosts excluded due to elevated OOM
**All of our jobs have spark.excludeOnFailure.enabled to mark hosts with too many failures as bad and not schedule tasks on them. This includes OOM errors and, for some jobs with increased OOM failures, it excluded many hosts, which made it harder to schedule tasks. As OOM errors are not as concerning anymore with Auto Memory Retries, we made a change to exclude OOM failures from the failure statistics when the feature is enabled.
Future
**Proactive Memory Increase
**When the memory configuration of a job is below the P90 requirement for a job, a lot of tasks will have to be retried. We see this more frequently in our ad hoc submissions, where configurations are not tuned as well as in our scheduled jobs. Having a very significant number of tasks being retried is costly as the tasks first have to run and fail, then the cluster manager needs to launch a new pod in the Kubernetes cluster after it has been OOM terminated. We improved this by introducing proactive memory increases, where we monitor the OOM failure rate during a continuous sample period. If the percentage of task OOM errors rises above a threshold, all remaining tasks in the stage will get a retry profile assigned, even if they have not run yet. The advantage of that is that if a certain stage is more expensive than all others, only that one will use the retry profile proactively, while the rest remain at the default profile. This addition is currently being rolled out.
Press enter or click to view image in full size
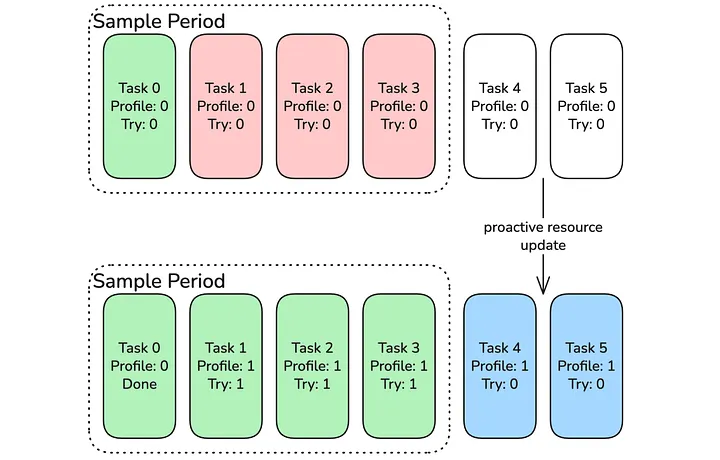
Figure 9: Task Resource profile is updated after frequent failures during sampling period
**Enhanced Auto Tuning
**With this feature rolled out, we are increasing our efforts around auto tuning jobs. Previously, we automatically updated a job’s memory configurations to match historic memory usage. We know that in most cases, we can further decrease memory usage as the JVM greedily uses available memory. With Auto Memory Retries enabled, we can further reduce memory usage, knowing that the job will not fail in production due to OOM errors. This allows us to tune memory for the P90 usage instead of the maximum used. With this feature enabled, we hope to achieve multiple million dollar cost savings for our platform and reduce our job’s core to memory ratio to match the physical hardware due to reduced default memory configurations.
Conclusion
We successfully rolled out the Auto Memory Retries feature to production, drastically reducing OOM failures by 96% and therefore reducing platform cost and on-call load for us and customer teams significantly. [1] Our team gained a deep understanding of the Apache Spark scheduler, and this will guide future improvements and job optimization. It has been very rewarding to create this feature, and our next steps are to engage with the community about integrating our Auto Memory Retries feature into Apache Spark for everyone!
Acknowledgements
I would like to thank my leads Zaheen Aziz and Ashish Singh, for their guidance during the design and implementation of the feature. I would also like to thank everyone on the Batch Processing Platform team at Pinterest who provided feedback, reviewed code, and supported the rollout.
References
¹ Pinterest Internal Data, US, January 2026
² Pinterest Internal Data, US, November 2024