Using LLMs to infer grocery preferences from DoorDash restaurant orders
Consumers enjoy DoorDash deliveries from a variety of merchants, ranging from restaurants to pet stores. To provide top-quality customer service, it is critical that we can recommend useful items, even if it is a consumer’s first time shopping within a given vertical. This is commonly referred to as the cold start problem. Here we discuss one of those intersections where we tackled how to help consumers new to grocery and convenience delivery. Our efforts identified relevant items using consumers’ DoorDash restaurant histories to build a set of explicit recommendations.
Restaurant order history provides a rich source of implicit consumer preferences, from culinary tastes to lifestyle and dietary habits. We wanted to determine whether we could leverage this data to understand their potential grocery needs. Large language models, or LLMs, became a powerful tool for interpreting semantic nuances alongside trained world knowledge to infer underlying preferences.
Our solution employs LLMs to translate a customer's restaurant order history into personalized grocery and convenience recommendations. For example, through statistical analysis and LLM inference, our system analyzed my restaurant order history to surface highly relevant grocery recommendations, shown in Figure 1, such as hot pot soup base, potstickers, and burritos — all items I personally love and frequently purchase. This blog post details how we developed a scalable, evaluation-driven pipeline to tackle the cold start problem and deliver relevant recommendations from the outset.
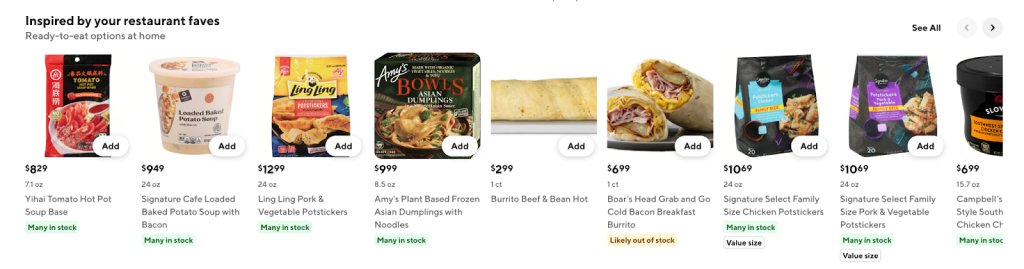
Figure 1: This horizontal product lineup includes nine personalized grocery items with product photos, prices, sizes, stock badges, and an “add” button on each option. A header reads “Inspired by your restaurant faves,” with the subheader “Ready-to-eat options at home.”
When conceptualizing a solution for cold-start recommendations, a seemingly straightforward idea quickly emerges: We could feed the recent order history for each of DoorDash's more than 200 million active restaurant customers into an LLM that is preloaded with our entire grocery taxonomy. We could then prompt the LLM to predict relevant grocery categories for each customer. While appealing in its simplicity, this naïve approach presents significant practical hurdles, including:
- Context bloat and hallucinations: LLM performance is sensitive to context size. Introducing hundreds of individual items and thousands of item names or taxonomies simultaneously can lead to degraded output quality, increased hallucinations, and less consistent recommendations.
- Throughput and cost scalability: Our objective is to refresh these signals frequently to capture evolving customer tastes. At this scale, even with a modest-sized LLM, end-to-end inference could quickly incur seven-figure costs per full run, rendering it financially and operationally unfeasible.
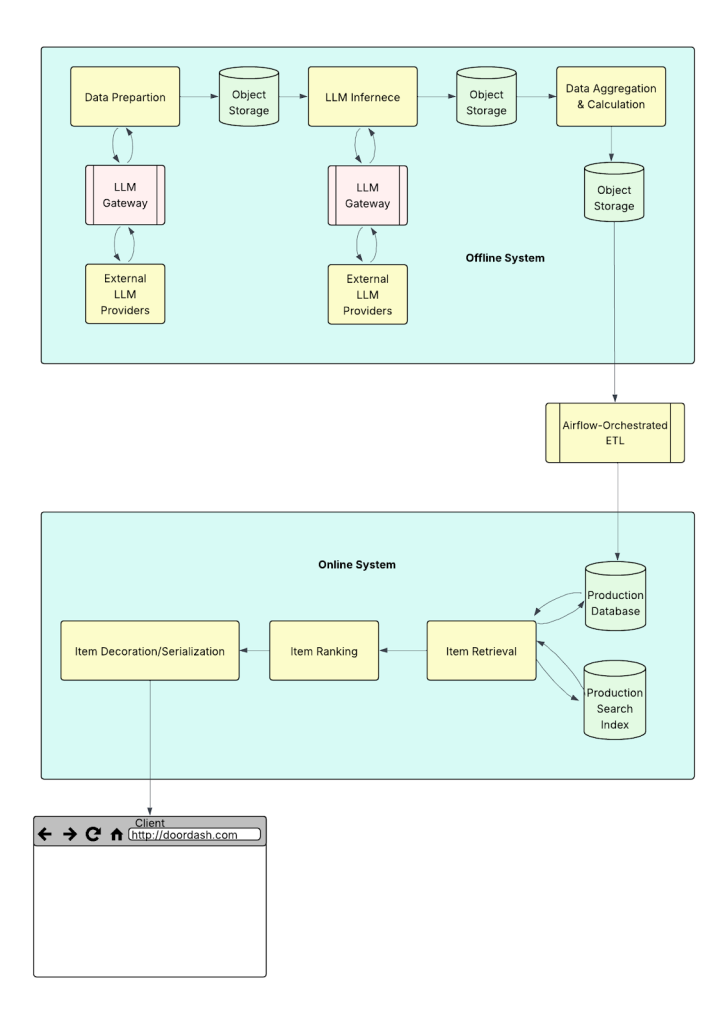
Figure 2: This diagram illustrates DoorDash's refined, hybrid approach to cold-start grocery recommendations. The multi-step pipeline represents restaurant orders as tags, maps tagsets to grocery taxonomies using LLMs offline, and combines these with personalized scoring to generate recommendations. These signals are then used by online systems to deliver personalized content to consumers.
Given these constraints, we opted for a more pragmatic and efficient architectural design that compresses each user's signal before strategically engaging LLMs where they are most effective, as shown in Figure 2 below, which involves the following steps:
- Represent orders by tags: Instead of raw item data, we leverage DoorDash's existing infrastructure in which each restaurant item is associated with descriptive dish tags, dietary tags, and cuisine tags. We represent historical orders using these tags and aggregate them by recency and frequency to distill user preferences.
- Offline tagset-to-taxonomy mapping with LLMs: Rather than repeatedly prompting an LLM with each user's entire history and the full grocery taxonomy, we perform a crucial compression step. Weekly, we map unique tagsets — combinations of dish, cuisine, and dietary tags — to relevant grocery taxonomies. With tens of thousands of unique tagsets, this approach is significantly more scalable and efficient than making individual LLM calls for all of the users. This offers substantial cost savings of approximately 10,000 times per run, making it financially sustainable compared to the seven-figure costs per run of a naïve, uncompressed approach. These precomputed mappings are then reused at runtime across all users.
- Personalized scoring and selection: We score the most indicative tagsets for each user based on the aggregated historical data. These scores, combined with the precomputed mappings, allow us to compose a personalized set of recommended grocery items.
- Online retrieval and ranking: After generating and storing user grocery taxonomy preferences offline, we leverage DoorDash’s existing multi-stage personalized retrieval strategy, two-tower embedding (TTE), and a personalized multi-task MMoE deep learning (MTML) based ranking strategy. These systems retrieve and rank recommended items in an online system, enabling us to deliver personalized content to consumers with minimal latency.
This design keeps LLM contexts small and focused, offloads expensive work to shared offline jobs, and ensures consistent, high-quality signals at scale.
Restaurant items on DoorDash are associated with descriptive dish, dietary, and cuisine tags — for example, "Classic Chicken Sandwich" might be tagged with "Chicken Sandwich" as the dish, "American" as the cuisine, and "non-vegetarian" as the dietary tag. Before LLM inference, it's crucial to clean, normalize, and filter this tag data for quality.
We encountered two issues as we sought tag data quality:
- Contradictory tags: For instance, a dish tagged "buffalo chicken wings" with a dietary tag "vegetarian."
- Overly generic tags: For example, "Meat" + "Asian" conveys little about concrete preferences.
We built an LLM-assisted cleaning and filtering pass to standardize the input signal:
- Schema and invariants: Reject conflicting dietary combinations.
- Specificity filters: Drop low‑information combinations such as very coarse dish + broad cuisine to emphasize distinctive tastes.
- Canonicalization: Standardize capitalization, synonyms, and tokenization while deduplicating near‑equivalents.
This resulted in a sharper, more semantically consistent tag vocabulary that improves downstream mapping and reduces noisy recommendations, as shown in the following table:
| Dish Tag Name | Cuisine Tag Name | Dietary Tag Name | Result | Rationale |
| Chicken and Shrimp | — | — | FILTER_OUT | A combination of proteins that could be part of far more than 50 unconnected dishes. |
| Vegetarian Sauce | Mediterranean | — | FILTER_OUT | Vegetarian sauce is an ingredient; while the Mediterranean cuisine tag narrows down related items, there are still many fundamentally different food items that can relate to the pair. |
| Meat Bowl | American | Vegetarian | FILTER_OUT | The tag combination evokes a recognizable set of dishes, but the dish tag is explicitly non-vegetarian. |
| Dumplings | Mongolian | — | KEEP | The dish tag 'Dumplings' is highly specific, ensuring a focused selection even with the 'Mongolian' cuisine tag. |
Subscribe to our Engineering blog to get regular updates on all the coolest projects our team is working on
We then faced the challenge of mapping unique tagsets to grocery taxonomies. While LLMs are powerful, directly prompting an LLM with all taxonomies for each mapping could generate an excessive context size that would induce hallucinations and degrade output quality. To mitigate this, we implemented a robust retrieval augmented generation, or RAG, layer, strategically applying several prompt engineering techniques:
- Embed everything: We begin by creating text embeddings for every tagset and every taxonomy node. This forms the foundation for our retrieval step.
- K-NN narrowing: For a given tagset, we perform a K-nearest neighbors (K-NN) search to retrieve its top roughly 200 nearest taxonomy candidates by cosine similarity. This critical step drastically reduces the LLM's input context, focusing it only on the most relevant possibilities.
- Constrained LLM mapping with prompt engineering: We then prompt the LLM with the narrowed candidate set. Here, several prompt engineering techniques come into play to ensure consistently high-quality outputs:
- Few-shot examples: We provide the LLM with a small set of meticulously crafted examples showing correct tagset-to-taxonomy mappings. This helps the model understand the desired output format and relationship inference.
- Explicit rubrics: We define clear guidelines and criteria for the LLM to follow when evaluating relevance, helping it make more consistent judgments.
- Strict input/output formats: We enforce specific JavaScript object notation or structured text formats for both the input — the tagset and the 100 candidates — and the output, which is a ranked subset of relevant taxonomies with discrete relevance scores. This minimizes parsing errors and ensures the output is directly consumable by downstream systems.
This hybrid approach, augmented by careful prompt engineering, drastically reduces context, curbs hallucinations, and produces stable, reusable tagset-to-taxonomy mappings with high confidence scores, as shown in the table below:
| Dish Tag Name | Cuisine Tag Name | Dietary Tag Name | Recommended Taxonomies | Taxonomy Relevance Scores | Business Vertical ID |
| Yellowtail Scallion Roll | – | – | [Seafood Sides, Prepared Fish, Sushi, Frozen Edamame] | [3, 4, 5, 3] | 68 |
| Sesame Chicken | Chinese | – | [Fresh Rice, Frozen Chicken Dinners, Frozen Egg Rolls, Frozen Dumplings] | [3, 4, 3, 3] | 100 |
| Mixed Green Salad | Mediterranean | Vegetarian | [Vegetable Sides, Pita, Salads, Hummus] | [3, 3, 5, 3] | 68 |
Once tagset-to-taxonomy mappings are established, we transform each consumer’s restaurant order history into a structured probability distribution over grocery taxonomies.
Here’s an example six-month order history, maintained for each consumer, with tags and recency:
| order_item_id | item_dish_tags | item_dietary_tags | store_cuisine_tags | days_ago_ordered |
| 3890 | [Meat, Burger] | [] | [American Traditional] | 2 |
| 8876 | [Soup] | [Vegetarian] | [] | 17 |
| 5219 | [Cake, Baked Goods] | [] | [Chinese] | 30 |
For each item, we derive a set of tagsets G = { g ∈ G }, where a tagset is a tuple of dish, cuisine, and dietary attributes. For example, an order of “burger” (item 3890) from an American Traditional store may yield: g₁ = ⟨Meat, American Traditional⟩ and g₂ = ⟨Burger, American Traditional⟩. Each consumer’s order history over a fixed horizon — in this case, six months — is thus represented as a multiset of tagsets Gᵤ = { g ∈ Gᵤ }.
We also have our precomputed mappings for each tagset from our previous step. These are a set of related taxonomies with LLM relevance scores 1 through 5, with 5 being the most relevant.
With this information, we define a tagset scoring model s(g) that captures both recency and frequency of the signal.
- Recency: r = 𝑒 -𝜆*𝑑 𝑟𝑒𝑐𝑒𝑛𝑡
- 𝜆 is a tunable parameter initially set to the value of 𝜆 = 𝑙𝑛2 / ℎ, ℎ being a tunable “half life” in days;
- 𝑑 𝑟𝑒𝑐𝑒𝑛𝑡 is the number of days ago of the most recent order item having the given tag attached
- Frequency: Normalized by the consumer’s total orders to mitigate bias toward heavy users.
- 𝑓 = # 𝑐𝑜𝑢𝑛𝑡(𝑔) / 1 + 𝑐𝑜𝑢𝑛𝑡(𝑔)
Then the combined signal can be computed as either a product or a weighted sum of the frequency and recency score, depending on which seems to capture user taste best, that is:
𝑠 = 𝑓 * 𝑟 or 𝑠 = 𝛼𝑓 + (1 - 𝛼)𝑟 with 0 ≤ 𝛼 ≤ 1.
From the top k tagsets, we calculate the score of each taxonomy related to that tagset, 𝑡, as the product of the tagset score and the relevance score of that taxonomy to the tagset.
For example, for a given consumer, we might compute the top three tagsets as:
| tag_set | frequency_score | recency_score | tag_score |
| Soup | 0.128 | 0.912 | 0.117 |
| Poultry, Chinese | 0.107 | 0.955 | 0.102 |
| Noodles, Vegetarian | 0.107 | 0.831 | 0.089 |
Then if ‘Soup’ as a tagset has the following taxonomies related to it with the respective relevance scores: {Soup, Canned Vegetable Soups, Canned Meat Soups} and {5, 4, 4}, we would compute 𝑡('Soup') = 0.117 * 5, t('Canned Vegetable Soups') = t('Canned Meat Soups') = 0.117 * 4. We then select from all computed taxonomy scores of all taxonomies associated with the top tagsets the taxonomies with the N highest scores, considering only the highest score of a taxonomy if it is associated with multiple tagsets, as shown below.
| Consumer Id | Business Vertical Id | Recommended Taxonomies |
| 12345 | 68 | ["Kimchi", "Tofu", "Soju", "White Rice", "Pork Belly"] |
| 12345 | 100 | ["Soy Sauce", "Sea Vegetables", "Miso", "Bok Choy"] |
| 23456 | 100 | ["Burritos", "Salsa", "Spanish Rice", "Cilantro"] |
To iterate rapidly on prompt quality and mapping accuracy, we used LLM‑as‑judge in all of the offline generation stages.
For example, the LLM judge that evaluates the tagset-to-taxonomy mapping receives the tagset and the model’s selected taxonomies and rubric. It then assigns relevance scores from 1 to 5. We compare the model’s scores vs. the judge’s scores with multiple metrics, evaluating the performance of different prompts. Among the metrics used were:
- Mean absolute error: Average absolute difference between paired scores, with lower being better.
- Quadratic weighted kappa: Agreement on ordinal labels; penalizes larger disagreements more strongly than linear weighting.
- nDCG@3: Order‑aware ranking quality for the top three recommendations.
- Precision@3 (≥3): Fraction of the top three items whose judge scores were greater than or equal to 3. Note: We don’t optimize solely for this metric because finding the most relevant available items still matters even when all candidates are weak.
Once the feature is live in production systems, we will be relying on consumer feedback and data from A/B testing to evaluate it. Some online metrics include:
- Conversion r_ate_: The percentage of users who complete a desired action — making a purchase — after interacting with the feature.
- Add-to-c_art r_ate: The frequency with which users add items to their shopping cart after exposure to the recommendations.
- Order rate: The overall rate with which users place orders, reflecting the feature's impact on overall transaction volume.
In early testing, we observed statistically significant improvements to order penetration for both convenience and grocery after launching the first version of the LLM‑powered carousel. Here are a few of the early lessons learned:
- LLMs shine in cold‑start settings: When historical signals are sparse or siloed across verticals, LLMs can infer preferences from adjacent text‑like data, such as restaurant order tags, to bootstrap relevance in new domains.
- Structure beats raw text: Representing history as tagsets and reusing tagset-to-taxonomy mappings keeps context compact and stable.
- RAG reduces hallucinations: Narrowing the candidate taxonomy space before prompting the LLM improves accuracy and consistency.
- Hybrid stacks win: Pairing LLM‑generated signals with proven IR/ML systems, TTE for retrieval, and MTML for ranking helps deliver relevant recommendations.
- Evaluate with LLM judges: Quantitative judge‑vs‑model metrics let us iterate quickly on prompts and calibration.
Among our planned next steps, we will broaden LLM‑powered carousels seeded from restaurant data to more use cases, expand into more consumer signals other than the existing tags, and build a more holistic consumer profile for the convenience and grocery category by fusing additional behavioral and contextual features.
We would like to offer special thanks to Nimesh Sinha for sharing ML expertise and knowledge, to Simran Jumani who set up the first (Hierarchical) RAG in DoorDash and whose work gave us enormous inspiration on building our current system, as well as to Devon Meyer, Meg Watson, Camilla Zanon di Valgiurata, and Priya Trivedi for sharing valuable product insights and inspiration.
Statement of Non-Discrimination: In keeping with our beliefs and goals, no employee or applicant will face discrimination or harassment based on: race, color, ancestry, national origin, religion, age, gender, marital/domestic partner status, sexual orientation, gender identity or expression, disability status, or veteran status. Above and beyond discrimination and harassment based on “protected categories,” we also strive to prevent other subtler forms of inappropriate behavior (i.e., stereotyping) from ever gaining a foothold in our office. Whether blatant or hidden, barriers to success have no place at DoorDash. We value a diverse workforce – people who identify as women, nonbinary or gender non-conforming, LGBTQIA+, American Indian or Native Alaskan, Black or African American, Hispanic or Latinx, Native Hawaiian or Other Pacific Islander, differently-abled, caretakers and parents, and veterans are strongly encouraged to apply. Thank you to the Level Playing Field Institute for this statement of non-discrimination.