Tracking Down Mysterious ML Training Stalls
[

Chen Yang, Andrew Yu, Shunyao Li, Pong Eksombatchai, Mark Molinaro
Introduction
Pinterest’s ML training platform, MLEnv, is a collection of external software dependencies and in-house built high performance ML library centered around Meta AI’s PyTorch. Upgrading the PyTorch version involves the upgrade of a web of dependencies together with necessary code changes. In most cases, this is just mundane work… until it isn’t.
During Pinterest’s latest effort to upgrade PyTorch’s version, instead of seeing neutrality or improvements of training throughput, we saw a sharp drop (>50%) in performance. Debugging the root cause turns out to be an interesting journey, from observing the throughput impact all the way down to identifying the culprit low-level linux kernels. This blog post documents our debugging process. We hope it can help a broader audience for their future work.
Background
Before we start, let us briefly review the ML model training process. A distributed data parallel ML trainer generally contains these steps: data loading, model forward and backward pass, all-reduce synchronization among GPU ranks, and an optimizer that applies the gradients to model weights. Depending on the model architecture, there may be additional synchronization points during the forward and backward pass. At Pinterest, we also leverage Anyscale’s Ray to horizontally scale the data loader (see here), where the bulk of data transforms are put in a remote CPU worker node, and only a lightweight data loader is kept within the main training process. With such a setup, we not only eliminated the data loading bottleneck, but also unlocked many interesting opportunities (such as Ray Last-mile Data Processing).
Press enter or click to view image in full size
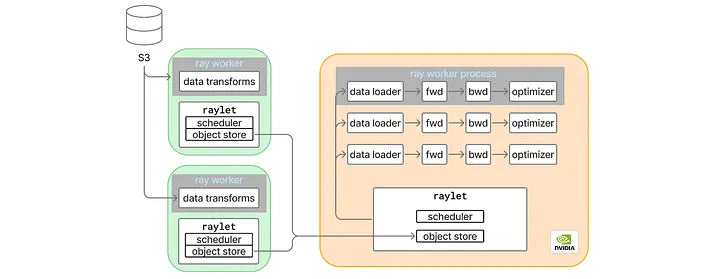
Figure 1: Pinterest ML Trainer Architecture
To keep our ML infrastructure modern and empower our MLEs with the best tools, it is paramount that we upgrade PyTorch to its latest versions. A large part of GPU efficiency gains comes from the adoption of optimized GPU kernels and the adoption of torch.compile; both are quickly iterated and improved upon each PyTorch upgrade.
The Problem
Unfortunately, our latest PyTorch upgrade effort resulted in a 50% drop in training throughput in terms of examples per second. Something was obviously wrong, but given that a web of dependencies were also changed together with a fairly complex training process setup, it was a daunting task to root cause the issue. What caused the stalls?
Fix the GPU Roofline
To narrow down the problem space, the first thing we checked was the GPU roofline throughput, a metric that measures the training throughput when we remove the data loader from the trainer by caching a batch on the GPU and reusing it. If the data loader is not a bottleneck, then the GPU roofline throughput provides an upper bound estimation; otherwise, one should focus on data loader optimization in order to improve the end-to-end throughput.
Press enter or click to view image in full size
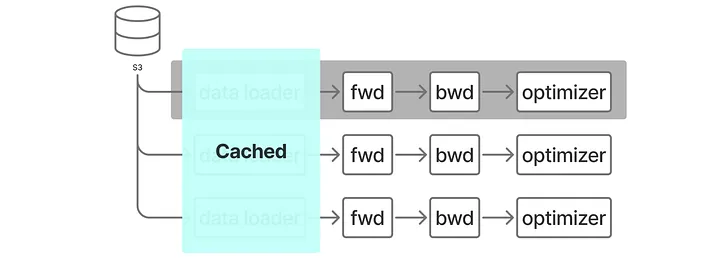
Figure 2: GPU Roofline Throughput Measurement Architecture
It turned out that for the GPU roofline measurement, the upgraded PyTorch version already resulted in a -20% in throughput. Without fixing this, there was no way we could achieve neutral performance.
Breakdown the Model
There’s no need to worry about data loading since we focused on the model. Nothing stood out during our initial examination of the PyTorch profiler trace. It seemed as if it was generally slowed down at every module. Or is it?
Were there specific modules that contributed to the slow down the most? To answer this question, we took the modules out of the model one by one until the throughputs were identical between versions. We were able to identify one of our most expensive transformer modules (let’s call it module A) to be the culprit. Close examination of the PyTorch profiler trace of this module revealed something interesting: in the upgraded PyTorch version, we no longer saw the CompiledFunctions (Figure 3). We further verified that turning off the `torch.compile` indeed resulted in identical throughput.
Press enter or click to view image in full size
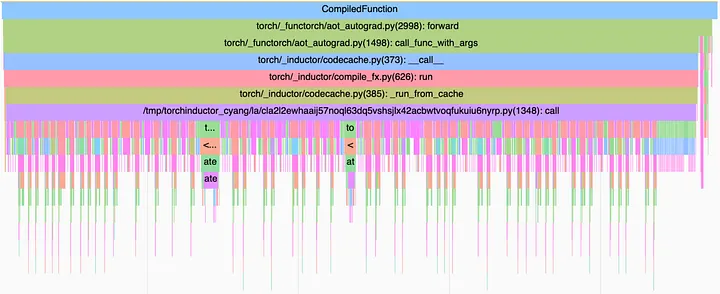
Figure 3: CompiledFunction PyTorch Profiler Trace for a Normal Trainer
Debug torch.compile
Was **torch.compile** broken in the new PyTorch version for this module? We turned on TORCH_LOGS=dynamo,inductor and reran the training, which showed that the problematic module was successfully compiled, but one line of log caught our eyes:
skipping: <operator_name> (**reason: non-infra torch dispatch mode present**, this is not supported today in torch.compile)
It indicates that the CompiledFunction was somehow skipped during runtime.
To isolate the issue, we built a series of minimal reproducible scripts to check if CompiledFunction would disappear in the trace:
- #1, only initializes module A and runs forward/backward in a simple training loop
- #2, initializes a simple model, i.e., our prod model, but removes everything else except module A, and runs it in a simple training loop
- #3, initializes the simple model and runs our trainer class’s training loop
Only #3 reproduced the issue, i.e., the disappearance of CompiledFunction in the trace. It became very clear that our trainer class interferes with torch.compile.
Pinpoint the Issue
Having narrowed down the issue to the trainer class, we had a much smaller code search space. We again built a series of repro cases by removing components of the trainer class, and finally noticed that the forward and backward pass were wrapped by a context manager:
with FlopCountMode():
...
It was added by our infrastructure engineers to track the flops during training, and it was enabled by default for every model. We recognized it as a PyTorch dispatch mode and connected it to the earlier suspicious log, so we disabled this mode, and it worked! The CompiledFunction reappeared in our regular training trace. For some unknown reason it only adversely affected the newer PyTorch version. We decided it is not worth our time to dig deeper, as there were more urgent issues to resolve. We will discuss these next.
Fix the End-to-End Throughput
Unfortunately, fixing torch.compile did not improve end-to-end throughput at all.
But now it has to be data loading, right? No. In the last section, when we measured the GPU roofline throughput, we took Ray completely out of the picture by launching the training as a native PyTorch application. When we launched the training as a Ray application, the GPU roofline throughput still suffered. This helped us rule out ray.data as the potential culprit.
Press enter or click to view image in full size
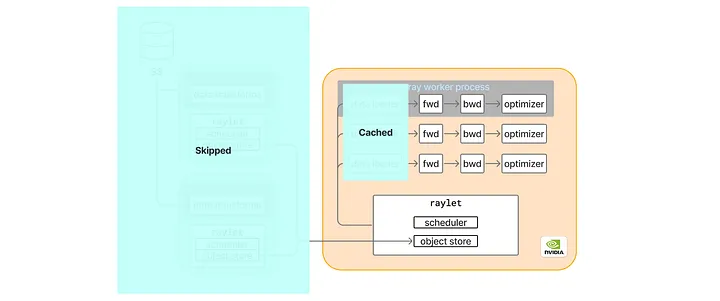
Figure 4: GPU Roofline Throughput Measurement Architecture for a Ray Application
Observations
Here are a few initial observations from various logs and a profiler trace:
- O1.1: The slow down is caused by slow iterations: roughly every three seconds there is one slow iteration, while every other iteration has identical latency compared to a normal run.
- O1.2: During the slow iteration, we observed a straggler effect: at synchronization points (usually during a NCCL kernel), one GPU rank was slow while every other rank needed to wait for it to catch up. What’s more interesting was that it seemed each GPU rank took turns in a round robin fashion to be the slow rank.
- O1.3: The slow rank could seemingly be stuck at any random Python function that is usually trivial.
- O1.4: Enabling Nvidia’s Nsight Systems profiler somehow eliminated the slowness: this was the weirdest observation, yet it was very consistent and reproducible.
- O1.5: Distributed training wasn’t the culprit either, since with a single GPU we could reproduce the slowness too.
Press enter or click to view image in full size
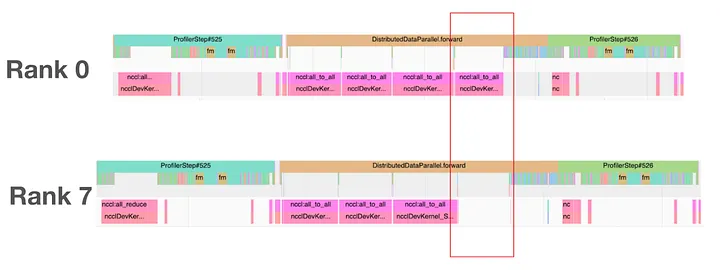
Figure 5: The Straggler Effect in the Slow Iteration
O1.1 led us to do a code search of three-second timers in the Ray repository. We found a few, but changing them made no differences. O1.3 made us suspect Python’s Global Interpreter Lock (GIL). Both Ray and PyTorch make extensive use of C++ extensions. Maybe in some other thread the GIL wasn’t properly released causing the main thread to be stuck? However it turned out to be challenging to verify this hypothesis since the PyTorch profiler doesn’t capture GIL events, and we cannot rely on the Nsight System due to O1.4, which itself was quite a mystery. O1.5 allowed us to focus on a single GPU rank without spending effort to find which rank stalled.
Is it torch.compile… again? We tried turning off torch.compile completely in the Ray setup, and it indeed resulted in identical throughputs between old and new PyTorch versions. In order to recoup the efficiency gains from torch.compile, we started to explore fine-grained compilation by only compiling certain modules, and we were able to achieve a better end-to-end throughput than with no compilation at all. Although we could not settle on such a solution, we learned one more observation: it was the modules with the most extensive graph breaks that caused the slow downs.
Given this observation, we came up with a minimal reproducible model that contained a single module where we artificially exploded the number of graph breaks. We used it to significantly speed up the debug iteration.
Diagnosis
Using the minimal reproducible model, we had the following observations:
- O2.1: Regular iterations’ latency was 5ms, while slow iterations were 25ms.
- O2.2: Slow iterations still happened roughly three seconds apart.
- O2.3: Occasionally there were some 500ms slow iterations.
- O2.4: Enabling Nsight System increased the regular latency to 12ms, but we also observed 19ms slower iterations.
O2.4 was especially critical, as the collected Nsight System trace on the minimal reproducible model became useful again. From the trace, it was very clear that no matter how long the slow iteration was (~25ms, or ~500ms), the main training thread held the GIL. This invalidated the hypothesis that GIL was the culprit. Closely examining the big pause, i.e., the 566ms in this example, we realized that it was due to the Python garbage collection. While it was a severe slow down for the minimal repro model, we did not have such observations in the regular training. Hence we believed that those small pauses, i.e., ~25ms iterations, were the true culprit for our training.
Press enter or click to view image in full size
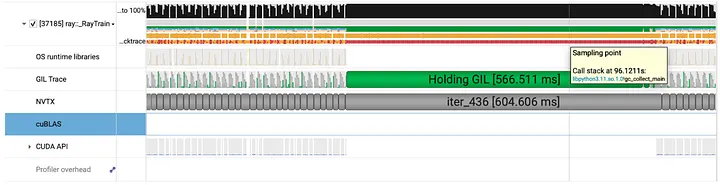
Figure 6: Nsight System Trace for the Big Pause
For the small pauses, however, we no longer saw the CPU backtrace and could not peak into what the thread was doing. It was holding the GIL and not making any progress, yet the CPU utilization was 100%. This led us to think that maybe it was other processes that were starving the training process by occupying the CPU. Thus far, we had been exclusively focusing on the training process. It was time to expand the search scope.
Press enter or click to view image in full size
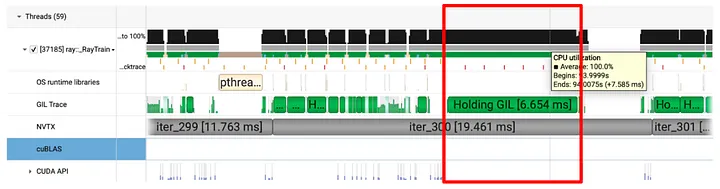
Figure 7: Nsight System Trace for the Small Pause
Finding the Root Cause
This time we resorted to the linux perf tool, we used the -a argument to collect callstacks for all the processes during a period. We knew the slow down would happen roughly every three seconds, so collecting a four second trace should be more than enough to capture it.
A proper visualization tool is also needed to examine the collected trace. Tools like Flamegraph aren’t suitable for this task, as it aggregates the callstacks, making the small pauses like 6ms impossible to find in a trace of seconds long for dozens of processes. We needed a time series representation, and chrome://tracing came to mind. Yet a format conversion tool wasn’t readily available. We turned to GenAI and asked it to generate a conversion script. With a few manual tweaks, the conversion script worked perfectly, and we were able to visualize the events as shown in the following graph.
Press enter or click to view image in full size
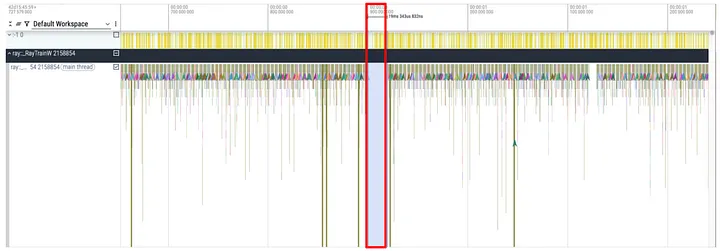
Figure 8: Time Series Callstack for the Main Training Process
Identifying the correct small pause in the trace wasn’t hard, we just needed to find the gaps where the training thread made no progress and the duration roughly fit the observation.
When we scrolled down to examine other processes, one of the Python processes looked suspicious: it was seemingly doing some expensive computing. Within the callstack, we noticed a call named smap_gather_stats, which is a linux kernel call that gathers virtual memory statistics.
Press enter or click to view image in full size
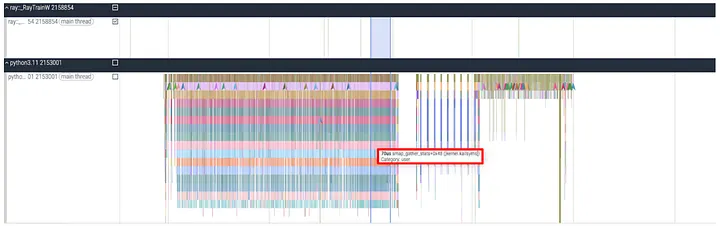
Figure 9: Time Series Callstack for the Suspicious Python Process
Zooming out and collecting a 10 second trace convinced us that this was very likely the culprit. This exact same callstack pattern happened roughly every three seconds, and we could always find a gap in the main training process within its call period.
Press enter or click to view image in full size
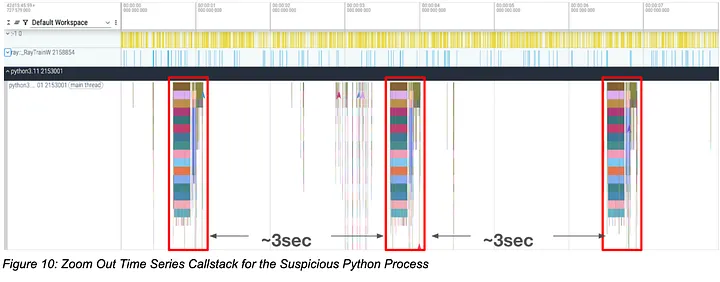
Figure 10: Zoom Out Time Series Callstack for the Suspicious Python Process
Unfortunately the perf callstack did not show us the Python stacktrace, so we had to use some tricks to identify the process. We recollected a trace while pausing the program at the very end, identified the pid of this Python process through searching the kernel name “smap_gather_stats”, and then went back to the dev machine and did a ps aux | grep <pid>. Voila!
The Culprit and Solution
The culprit: the Ray monitoring process ray/dashboard/agent.py. In particular, one of its tasks periodically reports Ray worker processes’ memory statistics, and in addition to the high level statistics, it also uses psutils.memory_full_info to collect detailed information.
The finding explains our observations.
- “It reoccurs roughly every three secnods”: in fact, the task is scheduled to run every 2.5 seconds. This also explains why our code search of three seconds timer was not effective.
- “The training thread is seemingly stuck”:
smap_gather_statswould put a lock on the page table while walking the target processes’ memory space and collecting statistics. The target process would have to wait for the lock release. - “A round-robin-like straggler effect”: the memory statistics collection for each worker happens in a
forloop of worker processes. In each iteration, when the collection happens, that particular rank would stall. - “Enabling Nsight System eliminates the slowness”:
agent.pytreatsraylet’s (Ray’s backend process) child processes as its worker processes. When enabling Nsight System, thensyswrapper becomes the child process, which apparently uses way less memory than the training process.
We hardly need such detailed memory statistics in our every day training runs, so we decided to remove it in our custom Ray build. Removing the psutils.memory_full_info fixed our end-to-end training throughput. With the newer PyTorch version, instead of seeing a 50% drop in throughput, we now have a 20% speed up — a 2.4x improvement!
Summary
We successfully identified the two root causes that significantly slowed down our training throughput. When tackling such complicated issues, breaking down the problem by building increasingly small reproducible test cases and adopting the proper tools for the problem at hand turns out to be extremely effective.
Throughout this journey, GenAI played a vital supporting role. We used it for rapid research, to understand unfamiliar system calls, and to quickly craft tools when off-the-shelf solutions weren’t available. Yet experienced engineers are essential for steering the investigation toward the right directions. We believe that when thoughtfully integrated, AI models substantially amplify engineering productivity.
Overall, we hope this blog post may inspire you for your present or future profiling and optimization efforts.
P.S. Interestingly, this exact same kernel call caused another performance issue in our serving systems, as detailed in this blog. While system monitoring is essential, it can introduce significant overhead; we should always be mindful of its potential impact.