Debugging the One-in-a-Million Failure: Migrating Pinterest’s Search Infrastructure to Kubernetes
[

Sanson Hu, Shashank Tavildar, Eric Kalkanger, Hunter Gatewood
While migrating Pinterest’s search infrastructure — which powers core experiences for millions of users monthly — to Kubernetes, we faced a challenge in the new environment: one in every million search requests took 100x longer than usual.
This post chronicles our investigation, uncovering an elusive interaction between our memory-intensive search system and a seemingly innocent monitoring process. The journey involves profiling search systems, debugging performance issues, Linux kernel features, and memory management.
Migrating Manas to Kubernetes
At Pinterest, search is a critical component of our recommendation system. When users visit their home feed, type a search query, or view related content, the results likely come from search.
To fulfill these searches at Pinterest-scale, we built an in-house search system called Manas. Today, Manas serves dozens of search indices empowering a wide array of teams within Pinterest to build performant recommendation features, and it is one of the most important services within Pinterest. Underneath it all, Manas manages more than 100 search clusters across thousands of hosts via a custom cluster management solution.
Over the past eight years since its inception in 2017, this custom cluster management system has become increasingly complex, opaque, and error-prone. To remedy this, we decided to migrate Manas to PinCompute, Pinterest’s in-house Kubernetes platform. We spent all of 2024 building out the new system on top of open source technologies like Envoy and Spinnaker, and incorporating new, custom components like a GitOps config management system and a new Manas-specific Kubernetes operator.
As we entered 2025, we were excited to validate our work and began performance testing. However, as we sent traffic to a test cluster, we noticed a problem: a small but persistent percentage of requests were timing out.
At our scale, a few timeouts per minute would result in a few users every minute receiving slightly degraded recommendations. While it might not impact metrics immediately, at best this issue would live on every single recommendation service at Pinterest. At worst, we worried the issue would slowly deteriorate into an ongoing, company-wide incident. The risk was too high, so we had to pause the migration and find a root cause.
Starting Our Investigation — Breaking Down Request Latency
To understand the request timeouts, we need to unpack how Manas serves search requests.
First, Manas has a two-tier architecture: root nodes service requests (by fanning out to leaf nodes), while leaf nodes serve a shard of a particular search index.
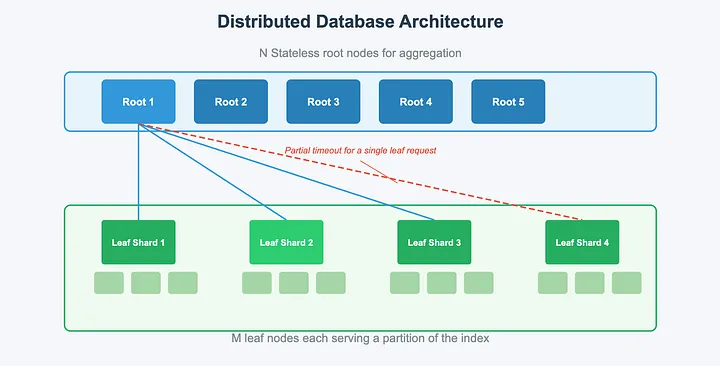
Manas’s two-tiered fanout architecture — a root node fans out requests to a leaf node per shard, then aggregates and returns the response
Leaf nodes handle requests in four phases: process the query, retrieve candidates from a memory-mapped lookup, rank and hydrate candidates via an additional memory-mapped lookup, and finally return results back to the root.
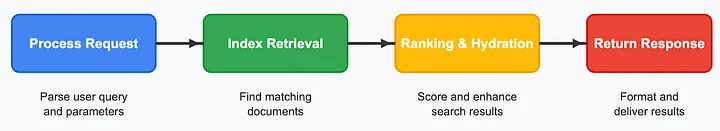
Leaf node query processing — four phases of query processing, where index retrieval and ranking & hydration both perform index lookups
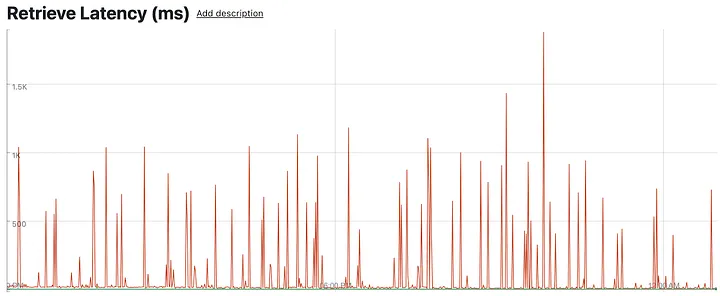
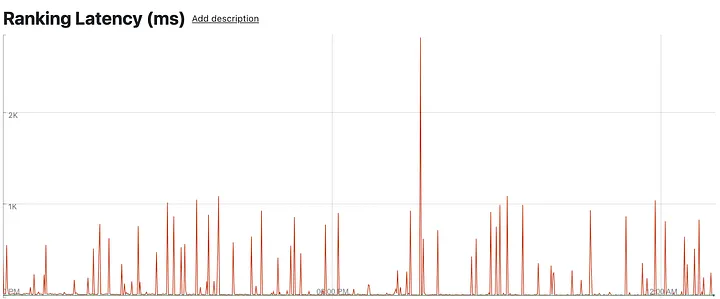
Now we can examine our timeouts. Aggregated across leaf nodes, max serving latencies were extremely high, while p9999 and below were in the normal range. Concretely, we were expecting normal max latencies to be under 60ms, while we were seeing up to 5s, almost 100x worse. Something was up at the leaf level.
Aggregate leaf serving latencies (top in red: P100; barely visible below: P99 and others)
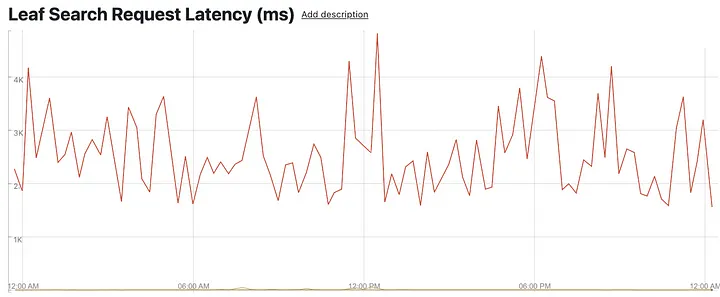
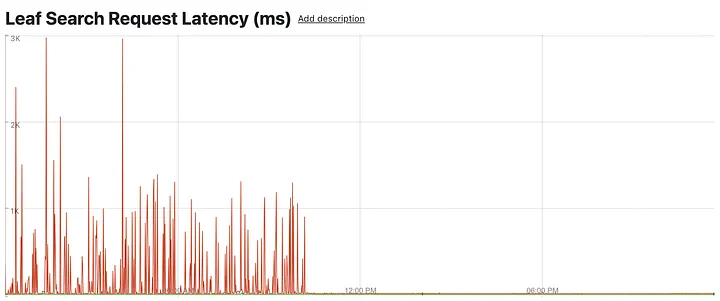
We then zoomed in to look at a specific leaf node, observing the retrieval and ranking phases for shorter time intervals. Suddenly, we see the smooth P100 curve decay into sharp latency spikes occurring every few minutes, falling back to almost normal in between.
Single-node leaf retrieval latencies (i.e. time to search the index) — sharp P100 spikes every few minutes (top in red: P100; barely visible below: P99 and others)
Single-node leaf ranking latencies (i.e. time to rank the candidates) — sharp P100 spikes every few minutes (top in red: P100; barely visible below: P99 and others)
This was unexpected. Retrieval and ranking are both done in a single thread per request, so something was either interrupting it away from the CPU or making the work itself slow.
We were sending tens of thousands of requests to each leaf node. Spikes at max latencies every few minutes per node meant we were dealing with a rare event — something that would occur with a one in a million chance for each request.
Narrowing the Problem Space
To tackle this challenge systematically, we began by simplifying our testing environment to eliminate potential variables.
We were already giving Manas pods exclusive nodes access and dedicated networking, so next we re-provisioned the test search cluster onto a larger EC2 instance type with sufficient memory to serve the entire index from memory, minimizing page faults. We also used the same AMI for the Kubernetes nodes as we were using for our current production EC2 Manas clusters. Lastly, we removed cgroups limits for CPU and memory, even going as far as running Manas directly on the Kubernetes node, outside a container.
Unfortunately, exactly zero of these changes had any effect. We still saw identical latency regressions. Something was interfering with Manas that was unique to the Kubernetes provisioning on top of the AMI.
We then continued into a two-pronged approach: clearbox debugging via OS-level profiling, and blackbox debugging via continuing to isolate possible variables between the Kubernetes nodes and current production nodes.
On the clearbox side, we sampled CPU, memory, and network utilization, correlating them with latency spikes. We used perf to look at CPU scheduling events, comparing preemption rates between Kubernetes and current production. We also checked cache utilization between the two systems and kernel lock contentions.
On the blackbox side, we isolated the Manas pod from other processes via CPU shielding using taskset and cpusets, eventually giving the main Manas leaf process dedicated access to almost all CPUs on the node. As mentioned, we also ran the Manas binary outside its container entirely, directly on the host, similarly shielded, eliminating the likelihood of cgroups throttling.
Again, unfortunately, neither approach yielded any results. We saw no noticeable signs of CPU stealing or preemption issues, and attempting to protect against the same had no visible impact.
However, the information we learned was still valuable, and we knew we were closing in on the problem. We felt confident there were no user space resource constraints, no bottlenecks to networking, memory, disk I/O, etc. We knew the issue was somewhere in the Kubernetes additions on top of the AMI, even if we didn’t understand the component or mechanism. And we knew the issue was transient.
Finding the Culprit
At this point in the game, it was time to take out the hammer. One by one, we used sudo kill -STOP to pause or suspend nonessential processes. We took out logging, stats pipelines, security, kubelet, and Pinterest-specific daemons. In lieu of available stats after taking out the daemons, we used root nodes as a proxy for leaf node health.
Eventually, we found our offender:cadvisor. After suspending it, all latency spikes immediately disappeared.
Aggregate leaf serving latencies (reduced # of leaf nodes, reduced interpolation) — P100 converges back to P99 levels after disabling cAdvisor (top in red: P100; barely visible below: P99 and others)
At last, progress.
Pinpointing the Root Cause
Unfortunately, we can’t permanently remove cAdvisor from PinCompute. It’s a critical component for exporting container-level metrics, and turning it off would mean losing monitoring capabilities and features like workload autoscaling.
Fortunately, observing the issue was straightforward and provided great hints as to the underlying issue within cAdvisor itself.
Using perf, it was clear the root cause involved calls to the smaps Linux kernel feature — cAdvisor was spending a disproportionate amount of time looking into memory information.
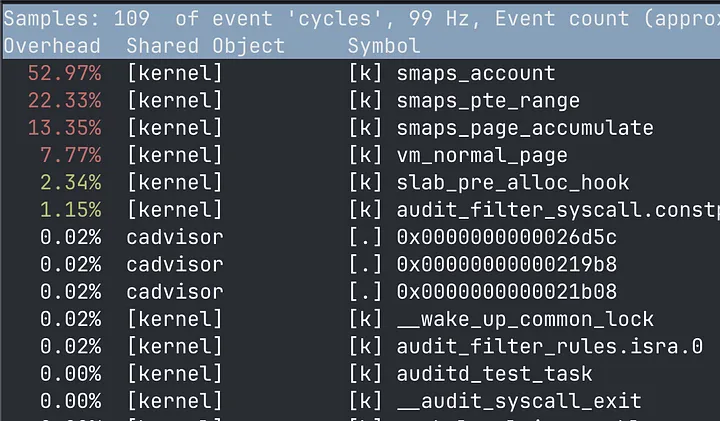
Perf top of non-Manas CPUs — vast majority of CPU time is spent in memory-related kernel spans
Reading through the cAdvisor docs, we see the offending metric annotated clearly with a warning.
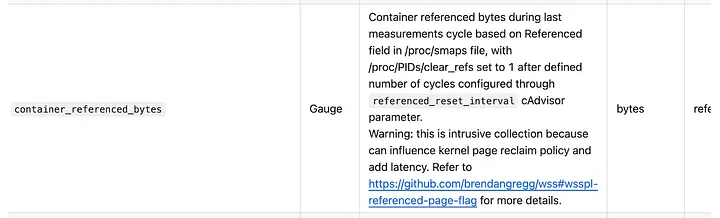
cAdvisor exported metrics documentation — describes container_referenced_bytes as an intrusive metric to collect
The metric container_referenced_bytes is enabled by default in cAdvisor and tracks the total bytes of memory that a process references during each measurement cycle. This measure implements Brendan Gregg’s working set size (WSS) estimation via the PTE accessed bit mechanism, which uses entries in the page table’s access bit to calculate the total amount of memory read or written by a process. Each time cAdvisor runs, it scans the entire page table to calculate this statistic by counting all the access bits in all entries, then clears every accessed bit. PinCompute runs cAdvisor every 30 seconds, meaning this invasive accessed bit checking and clearing occurred twice per minute, every minute.
Manas search indices can be hundreds of gigabytes per leaf node, and the secondary ranking index can be over a terabyte. When Manas leaf nodes start, they memory-map the entire index into memory. This means memory use can be significant (e.g. for a host with 100GB of used memory, the page table can hold 25 million entries). Walking then clearing 25 million page table entries every 30 seconds could definitely cause contention with the memory-intensive leaf processing. In fact, Brendan calls this out explicitly with a warning that his tool is intended to be experimental.
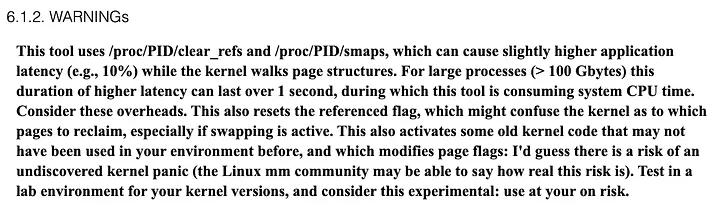
Brendan Gregg’s explicit warning — Describes this WSS collection mechanism’s side effects and risks
To summarize, each call to smaps acquires locks while scanning the entirety of the kernel’s page structures, while each call to clear_refs similarly acquires locks while scanning the entirety of the kernel’s page structures, flushing every page in the WSS from the TLB as it goes.
This finally was the likely cause for why our Manas leaf binary, with its 100GB+ of mapped memory, was stalling to 100x its normal latency on around one in every 1 million requests — cAdvisor-initiated memory contention.
This is where we ended our investigation. There is definitely still more to explore, from diving into the kernel source code, to adding and testing further instrumentation, and more. But with the remediation in hand, we felt the ROI would be low. We’ve found not every problem needs an exact solution, and good enough often gets the job done best. Unblocking and moving on, sad as it sometimes is, unlocks our larger goal of leveling up the infrastructure Pinterest engineers rely on to Put Pinners First.
Resolving the Problem
With the root cause identified, we disabled cAdvisor’s WSS estimation for all PinCompute nodes. A simple 1-line change was all that was needed. We also opened a GitHub issue in the cAdvisor repo to share our learnings.
While Manas was the first PinCompute system to encounter this issue, it was the canary surfacing the problem. This performance regression would have blocked every other memory-bound system from migrating onto our platform. Reaching stable serving latencies is a massive milestone for our Kubernetes platform at Pinterest. Manas is a demanding distributed system, and being able to reliably serve this workload opens the door to continuing to move other online services to the platform.
Reflecting on a few lessons learned:
- Resource isolation is tricky: e.g., CPU shielding is not a definitive way to isolate a process from its neighbors
- Narrow the problem space: validating that the issue wasn’t caused by the PinCompute AMI helped narrow the scope and saved us from chasing a lot of dead ends
- Blackbox debugging can be effective: don’t neglect simple strategies like breaking things until the system stops working; consider it a form of bisecting the problem as above
Diving into this issue was a learning experience for the team. Bringing together talent from across multiple subject areas at Pinterest to tackle a singular task was enlightening and rewarding. We want to acknowledge everyone involved for stepping in and helping resolve this issue:
- Debug working group: Hunter Gatewood, Sanson Hu, Shashank Tavildar, Eric Kalkanger
- Performance: Vibhav Garg, Eric Lopez
- PinCompute: Yi Li, Jinru He, Jiajun Wang, David Westbrook
- Core Retrieval: Van Lam, Abhishek Tayal
- Special thanks to Brendan Gregg (Intel) for his guidance, encouragement, and support