Building a high-volume metrics pipeline with OpenTelemetry and vmagent
A production-tested approach for moving a large-scale metrics pipeline from StatsD to OpenTelemetry and Prometheus.

Colorful vintage mugs filled with small flowers hang in rows on a chain-link fence, creating a vertical garden.
By: Eugene Ma, Natasha Aleksandrova
When migrating to a new monitoring system, you’ll want to frontload the work to collect all your metrics. This exposes bottlenecks at full write scale and unblocks the migration of assets which require real data for validation, such as dashboards and alerts. Collecting all your metrics first means you can focus on major technical challenges — scale, correctness and performance — without worrying about how users will adopt your new tools.
But for our project, this approach wasn’t straightforward: most of our metrics were instrumented with StatsD libraries, OpenTelemetry was gaining traction, and our new storage system was based on Prometheus. We were left with a lot of open questions. Where do we fork the metrics? Should we adopt OpenTelemetry? Do our metrics work well with Prometheus? The task of collecting metrics required us to answer these questions and rethink our metrics infrastructure.
Instrumentation and collection
Our services originally used the StatsD protocol, with a Veneur sidecar collecting and forwarding metrics to our vendor.
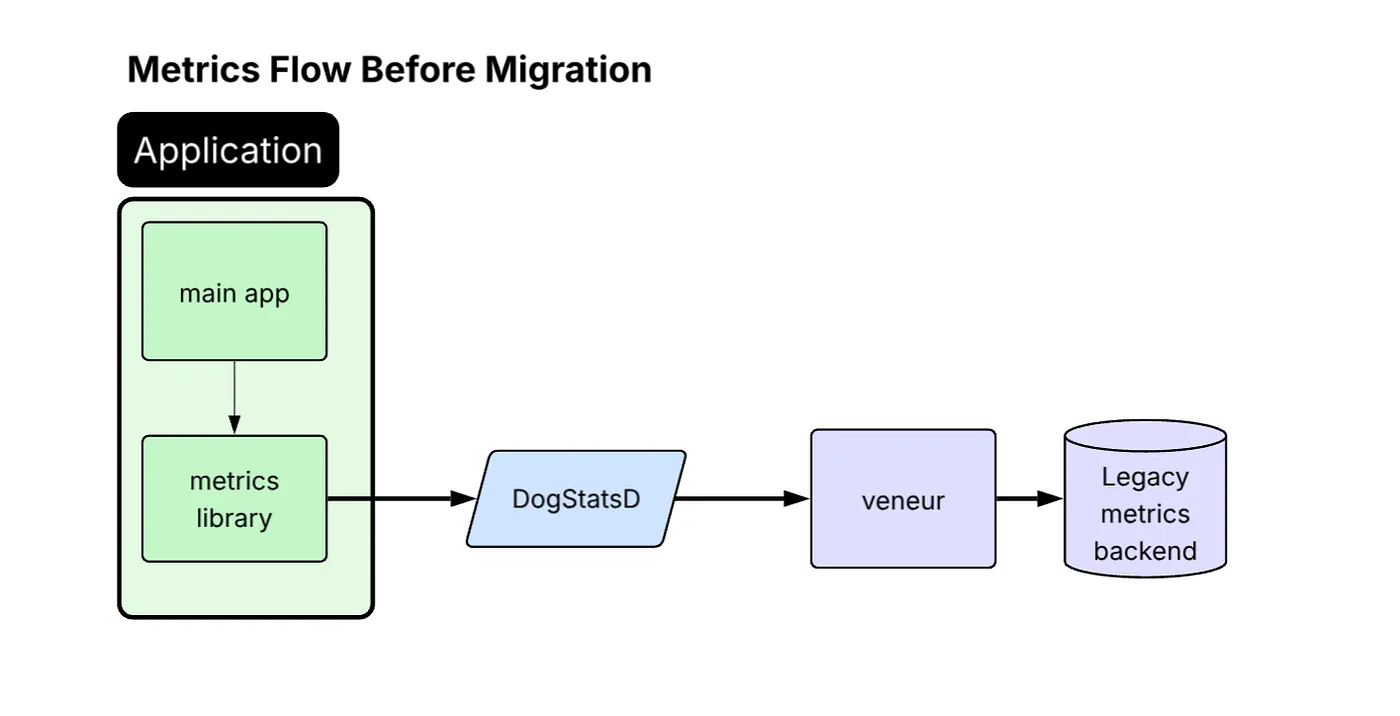
Diagram titled “Metrics Flow Before Migration.” Inside a green “Application” block, the “main app” feeds data to a “metrics library,” which sends metrics to a blue “DogStatsD” component, then to a purple “veneur” service, and finally to a purple cylinder labeled “Legacy metrics backend.” Arrows show the left-to-right flow through each stage.
For the migration away from this architecture, we defined a clear set of supported and preferred instrumentation protocols. OpenTelemetry Protocol (OTLP) is now recommended for internal services, while Prometheus is preferred for OSS workloads. StatsD (DogStatsD format) remains as a fallback for legacy paths or applications that are difficult to update / instrument.
This led us to adopt the vendor-neutral OpenTelemetry Collector (OTel Collector).
Dual-write migration approach
Roughly 40% of our services use a shared platform-maintained metrics library, which was the logical starting point for OTLP adoption and enabled broad rollout of OTLP emission across those services. By enabling this library to dual-emit metrics, StatsD for the existing pipeline and OTLP for the new OTel Collector, we made broad migration progress with low friction.
The collection pipeline during migration:
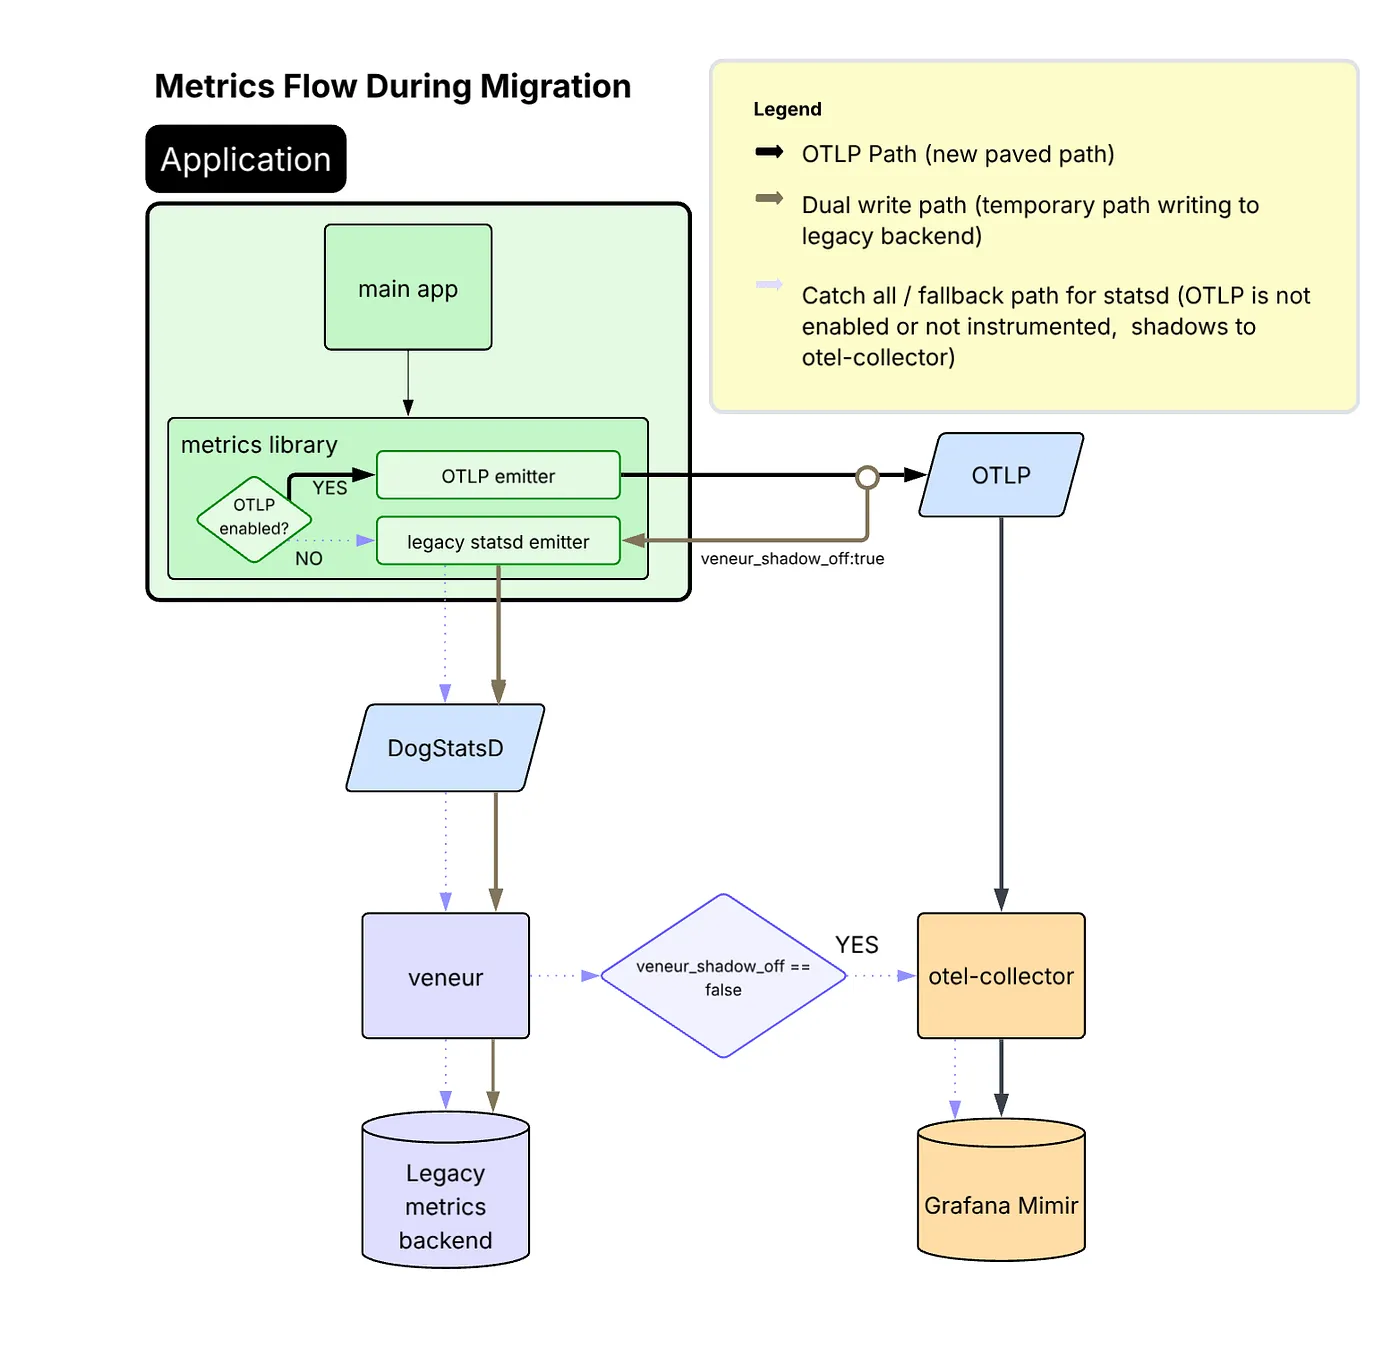
Migration diagram — inside the application, metrics can follow two paths: new OTLP emitter sends directly to an OTLP service and then to an otel-collector and Grafana Mimir, while the legacy statsd emitter still routes via DogStatsD → veneur → legacy backend; dual-write and fallback paths are indicated by different arrow styles.
Benefits realized by moving to OTLP
Moving to OTLP offered significant benefits over remaining on StatsD:
- JVM profiling data shows that CPU time spent on metrics processing dropped from 10% to under 1% of total CPU samples in production after migrating from StatsD to OTLP.
- OTLP provides greater reliability than StatsD, which relies on UDP and is more vulnerable to packet loss under high throughput.
- Emitting OTLP natively removed the need for an intermediate StatsD-to-OTLP translation step inside the OTel Collector.
- Because our backend is Prometheus-based, remaining on StatsD would have restricted users to classic histograms. OTLP enabled us to adopt Prometheus-native capabilities such as exponential histograms with full fidelity.
- OTLP is a CNCF-sponsored, vendor-neutral protocol and the de facto industry standard for telemetry. Moving to OTLP positions us to support future observability use cases without protocol barriers.
A challenge encountered with OTLP
While most services handled the dual-write OTLP + StatsD mode without issues, our highest-volume metric emitters (many of which are also among our most critical services) experienced significant regressions in performance after enabling OTLP. In particular, these services began to suffer from memory pressure, increased garbage collection activity, and heap growth.
Through investigation, we connected the performance issues to the fact that those services emit very high-cardinality metrics (on the order of 10K+ samples per second per instance). To mitigate this regression, we updated our common metrics library configuration to use delta temporality (AggregationTemporalitySelector.deltaPreferred()) for a select set of services. That change reduces the in-process memory burden, because delta temporality avoids retaining full state for all metric-label combinations between exports.
Based on our observations, we found that switching to delta temporality was only necessary for services emitting extremely high metric volume, so we left the rest of the services using default cumulative mode. That said, with delta metrics, unexpected failures result in visible gaps in the data, a trade-off we accepted in exchange for reduced memory usage and improved stability. With cumulative metrics, those same failures typically appear as a larger jump between data points rather than a gap.
The final collection picture
With OTLP now serving as the primary data flow and the fallback StatsD path maintained only where necessary, we arrived at a consistent and future-ready collection architecture. The OTel Collector anchors the pipeline, feeding directly into our Prometheus-based storage backend, with the legacy path available for compatibility.
This groundwork was essential before tackling more complex challenges like aggregation.
The diagram illustrates this final design and the complete flow of metrics through the system.

Flow chart showing an application’s metrics library sending data via OTLP (main path) or legacy StatsD (fallback) to an otel-collector, which then writes to Grafana Mimir.
Streaming aggregation
To keep costs under control, our previous pipeline used an internal fork of Veneur to aggregate away instance-level labels (e.g. pod, hostname) instead of submitting the raw metrics directly to our vendor. In the Prometheus world, we needed a similar aggregation step.
Rejected options
There were several options that we considered using, but discarded:
- Keep using Veneur: Continuing with Veneur required a significant rewrite to support Prometheus’ protocol and data model, and the fork was an ongoing maintenance burden.
- Recording rules: While recording rules are great for improving query performance, they require storing the raw data in the TSDB first, which undermines our cost saving goal.
- m3aggregator: Although battle-tested at other companies, the architecture seemed more complex than we wanted.
- OpenTelemetry Collector: Lack of support for metric aggregation, despite proposals.
- Vector: no built-in scaling capabilities. Written in Rust, which is not widely adopted at Airbnb.
Choosing vmagent
We ended up looking into vmagent from VictoriaMetrics.
Pros:
- Supports streaming aggregation for Prometheus metrics
- Supports sharding, providing a way to scale horizontally
- Documentation is extremely user-friendly and easy to set up
- It has a small codebase (~10K LOC), so it’s easy to understand and modify if needed.
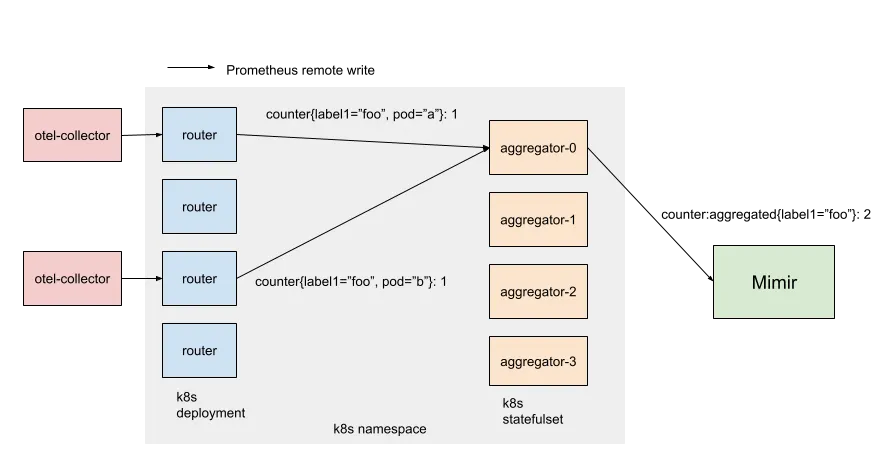
Diagram of two pink “otel-collector” boxes feeding metric data into a Kubernetes namespace. Within the namespace, four blue “router” pods (a Deployment) forward counters to one of four peach “aggregator-0…3” pods (a StatefulSet), which then send data onward to a green “Mimir” component.
Our architecture has two layers of vmagents: routers and aggregators. Routers are stateless and shard metrics by consistently hashing all labels except the ones you want to aggregate away (e.g. “pod”, “host”). Aggregators do the aggregation (i.e. summing over counters) and maintain the in-memory state of outputs (i.e. the current running total). On the command line, each router is passed a static list of aggregator hostnames (Kubernetes gives StatefulSet pods stable network identity). This simple approach avoids additional service discovery dependencies and keeps the metrics sharding consistent between pods.
Once we figured out how to scale vmagent, we made a few internal customizations to support our metrics environment (including native histogram support and Mimir-style multitenancy). More generic changes were contributed back upstream (5931, 5938, 5990).
The outcome
We achieved our goal of aggregating metrics: our single production cluster scaled out to hundreds of aggregators, ingesting over 100 million samples per second.
In addition to reducing the overall cost by an order of magnitude, our new aggregator pipeline provides another benefit. Because it’s centralized and processes ALL our metrics, it’s a convenient and powerful tool for other types of transformations. When users deploy a bad instrumentation change, it’s handy to drop problematic metrics. When users temporarily need raw metrics, we use it to dual-emit raw metrics on the fly.
Sparse counters
After migrating to our new Prometheus-based metrics pipeline, we noticed our PromQL queries over certain counters were consistently undercounting compared to our previous vendor.
Problems with rate()
The root cause lies in how Prometheus computes rates of change from cumulative counters. In a StatsD monitoring system, a data point measures the delta observed during a flush window (typically 10 seconds). In Prometheus, a data point measures the cumulative count starting from zero. In practice, you’ll use something like rate() or increase() to derive deltas, which are more meaningful to graph.
However, there is an edge case: when a counter is created, it may also be incremented at the same time.
Consider a counter that increments once and resets (due to pod restart) before it can increment again:
1 1 1 1 1 - - - 1
          ↑ reset
Each time the counter resets, the increment is lost before PromQL’s rate() function has a chance to derive a delta.
Initially, we anticipated that the edge case would have minimal impact, given Prometheus’s widespread adoption and proven reliability in diverse environments. However, as we migrated more users, we started seeing this issue more frequently, and it stalled migration. Airbnb systems have a tendency to generate many low-rate counters with high dimensionality. A counter tracking requests per currency per user per region might see any given data series increment only a handful of times a day, and these updates can be lost due to the issue with rate(). Yet, these were often critical metrics that product teams needed to monitor accurately.
Rejected solutions
Before arriving at our final approach, we considered several workarounds — each with significant drawbacks.
- Pre-initialize all counters to zero: Not practical given the number of callsites, in addition to not being able to predict all label combinations ahead of time.
- Ask teams to use logs for exact counts: Logs and metrics are separate systems and serve different use cases. We needed real-time dashboards and alerting on metrics. Telling teams to restructure their observability around our limitations wasn’t acceptable.
- Emit gauges instead of counters: Internally, Prometheus doesn’t distinguish between gauges and counters. However, by doing this, we’d be swimming upstream against Prometheus conventions.
- Add hacky PromQL adjustments: We could have asked users to pad their queries with various hacks. But this would push complexity onto every team writing dashboards and alerts.
Solution: zero injection
Clearly, the solution had to be transparent and systematic. The migration was already demanding a lot from our users, and it wasn’t reasonable to expect our team to modify every callsite ourselves.
The idea was simple: we needed to seamlessly inject zeroes in our metric stream. Our aggregation tier was already processing all our metrics in a centralized location, so it was the perfect spot to implement the change.
We implemented an Aggregator tweak: when we flush an aggregated count for the first time, flush a zero instead of the actual running total.
Consider a counter that increments by one every flush. Here’s what this looks like in practice:
![Table showing how an aggregator delays its first flush: 1 → injects zero (state 1, series [0]); 2 → flushes normally (state 2, series [0, 2]); 3 → continues (state 3, series [0, 2, 3]).](https://miro.medium.com/v2/resize:fit:1400/format:webp/1*4Hes3V8JBVNvXwG-Vvd6PA.png)
Table showing how an aggregator delays its first flush: 1 → injects zero (state 1, series [0]); 2 → flushes normally (state 2, series [0, 2]); 3 → continues (state 3, series [0, 2, 3]).
By injecting the synthetic zero, all counters are implicitly initialized to zero to match Prometheus counter semantics. The delayed flush is also important, it ensures the zero’s timestamp doesn’t conflict with any previous samples. There is one downside: the initial increment will lag by one flush interval, which isn’t a big deal in practice.
This approach required minimal changes to vmagent, kept the fix invisible to end users, and solved the problem at the source rather than papering over it downstream.
Conclusion
In this blog post, we talked about how we collected all existing StatsD metrics into a new, Prometheus-based metric pipeline.
We implemented a dual-write instrumentation strategy, adopting the OpenTelemetry Protocol (OTLP) while maintaining support for StatsD. This switch yielded performance gains and unlocked the use of features such as native histograms.
To manage costs and scale, we introduced a centralized, two-layer streaming aggregation pipeline using a sharded vmagent setup. Finally, we solved the issue of consistently undercounted sparse counters by implementing a transparent “zero injection” technique within our aggregation tier.
Our work demonstrates a practical, production-tested blueprint for migrating a massive, high-volume metrics pipeline to modern, open-source standards such as OpenTelemetry and Prometheus, all while maintaining data accuracy and cost efficiency.
If this type of work interests you, check out our open roles.
Acknowledgements
Thank you to the Observability team — Abdurrahman Allawala, Rong Hu, Callum Jones, Rishabh Kumar, Wei Song, and Yann Ramin — and our partners across the company who helped make this a reality.
We especially want to thank Helen Lee and Vlad Kostyukov for their support on OpenTelemetry instrumentation.
We also want to thank Suman Karumuri and Xuan Lu for their support in authoring this post during their time at Airbnb.
All product names, logos, and brands are property of their respective owners. All company, product, and service names used in this website are for identification purposes only. Use of these names, logos, and brands does not imply endorsement.