Bridging the Gap: Diagnosing Online–Offline Discrepancy in Pinterest’s L1 Conversion Models
[
Authors: Yao Cheng | Senior Machine Learning Engineer; Qingmengting Wang | Machine Learning Engineer II; Yuanlu Bai | Machine Learning Engineer II; Yuan Wang | Machine Learning Engineer II; Zhaohong Han | Machine Learning Engineer Manager ; Jinfeng Zhuang | Senior Machine Learning Engineer Manager
Press enter or click to view image in full size
Introduction
The L1 ranking stage sits in the middle of Pinterest’s ads funnel. It filters and prioritizes candidates under tight latency constraints so that downstream ranking and auction systems only see a manageable set of ads.
When we started pushing new L1 conversion (CVR) models, we saw the same pattern repeatedly:
- Offline: strong, consistent gains on loss and calibration across log sources and pCVR buckets.
- Online: neutral or negative A/B results, plus surprising mix‑shifts for oCPM traffic.
This gap between offline evaluation and online A/B performance, which we call our Online–Offline (O/O) discrepancy, kept promising models from launching.
In this post, we’ll walk through:
- How we structured the investigation, instead of chasing one‑off bugs
- What actually went wrong in features, embeddings, and funnel design
Background: Two Ways to Judge an L1 Model
For L1 CVR models, we look through two very different lenses:
Offline metrics
- Loss (e.g., LogMAE), calibration
- Breakdown analysis across candidate pools and pCVR percentiles
Online metrics
- Business metrics like CPA
- Funnel breakdown: candidate counts and recall across stages and optimization types, measured via A/B experiments
In a perfect world, a model that reduces offline loss and improves calibration would also improve conversions and thus reduce CPA eventually. In practice, for our new L1 CVR models we saw:
Offline
- ~20–45% LogMAE reduction vs. the production model across multiple log sources (auction winners and auction candidates).
- Better calibration and loss in every pCVR bucket on shared eval datasets, even after trimming outliers.
Online (Budget-Split experiments)
- Neutral or slightly worse CPA for key oCPM segments, despite the offline gains
- Non‑trivial mix‑shifts (e.g., more oCPM impressions) that did not match the offline story
In other words, models that were clearly better on offline metrics did not reliably translate into online wins.
How We Structured the Investigation
Instead of trying to guess a single root cause, we treated this as a full‑stack diagnosis and organized our hypotheses into three layers:
- Model & evaluation: Are the offline metrics themselves trustworthy? (Sampling, labels, outliers, eval design.)
- Serving & features: Is the system serving the same model and features we trained and evaluated? (Feature coverage, embedding building, model versioning, model serving pipeline.)
- Funnel & utility: Even if predictions are “correct”, can the funnel or utility design erase the gains? (Retrieval vs. ranking recall, stage misalignment, metric mismatch.)
For each bucket of hypotheses we asked: “Could this alone explain the O/O gap we see?” Then we used data to accept or reject it.
What We Ruled Out Quickly
1. Offline evaluation issues
We first revisited offline evaluation to make sure we weren’t chasing a mirage by:
- Re‑computed loss and calibration across three different log sources: auction‑winner samples, full‑request auction candidates samples, and partial‑request auction candidates samples.
- Broken results by pCVR percentiles to see whether gains only existed in “easy” buckets.
- Re‑evaluated production and experimental models on exactly the same data, including regenerated datasets with different log‑source mixes.
Across all of these, the experimental CVR model consistently:
- Beat the production model on log‑loss across all datasets we evaluated, by a wide margin
- Matched or improved performance in every percentile bucket, even after explicitly handling outliers
So the offline story was robust: the new model really was better on the data we were using. Offline evaluation bugs alone could not explain the neutral online results.
2. Exposure bias and traffic share
Next, we looked at exposure bias — the idea that when the control model owns most of the traffic, downstream systems and labels are optimized around it, making it hard for a small treatment to look good.
We ran a ramp where treatment traffic went from ~20% up to ~70%, and monitored online calibration and loss for both auction candidates and auction winners before and after the ramp
If exposure bias were the main issue, we would expect treatment metrics to improve as it owned more traffic. We did not see that pattern; the over‑calibration issue persisted even at higher treatment shares.
3. Timeouts and serving failures
Finally, we double‑checked timeouts and serving health by comparing success rate and p50/p90/p99 latency across control and treatment for both query and Pin towers.
We did not see materially worse timeout or tail‑latency behavior for treatment. This matched prior L1 investigations on engagement models, where timeouts rarely explained large O/O gaps.
Summary
In summary, across offline evaluation, exposure bias, and serving health checks, these were all necessary sanity tests, but none of them could, on their own, explain the discrepancy we observed.
What Actually Broke: Features and Embeddings
The deeper investigation converged on two structural issues where training and serving did not line up:
- Feature O/O discrepancy — the model was trained with features that were missing at serving time
- Embedding version skew — query and Pin towers were not aligned in time
1. Feature O/O discrepancy: training vs. serving
L1 Pin embeddings are built from indexing snapshots and fed into an ANN index used by retrieval and L1 ranking. This pipeline is separate from the L2 Feature Store used downstream. In other words:
- Offline, we trained and evaluated on rich logged features that included detailed advertiser and Pin‑promotion signals.
- Online, the embedding builder only saw the subset of features that had been explicitly onboarded into the L1 embedding.
When we put the two side by side (offline insertion tables vs. online feature‑coverage dashboards), it turned out several high‑impact Pin feature families had never made it into the L1 embedding path at all, including:
- Targeting spec flags (interest targeting, search‑term modes, auto‑targeting)
- Offsite conversion visit counts (1/7/30/90 days)
- Annotations and MediaSage image embeddings
These signals existed in training logs, so the model quite reasonably learned to lean on them. But at serving time, they were missing from the embeddings, which meant that for many oCPM and performance‑sensitive ads, the online model was effectively running on a much thinner feature set than the one it was evaluated on offline.
Press enter or click to view image in full size
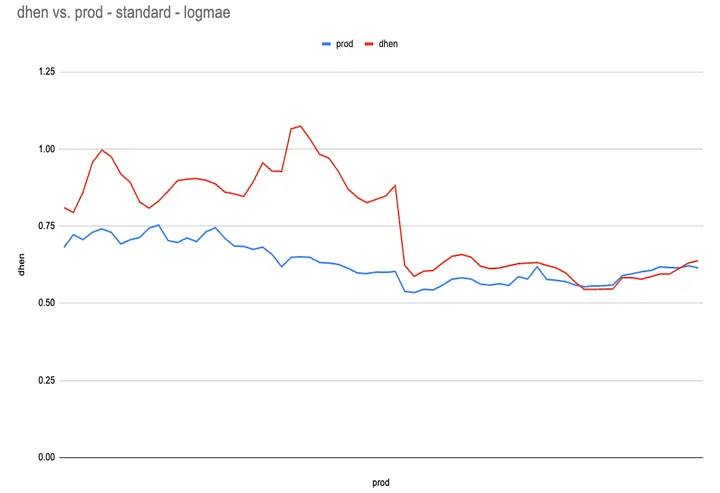
Figure 1: Operational/Offline Discrepancy — Absent Pin Features within L1 Embeddings
To fix this, we updated UFR configs to onboard the missing features into L1 embedding usage, and watched coverage recover in the online feature‑coverage dashboards, along with online loss moving in the right direction for both CVR and engagement models (especially on shopping traffic).
We also changed the default behavior in the UFR tooling so that features onboarded for L2 are automatically considered for L1 embedding usage, closing a recurring source of silent O/O issues.
Key lesson: It’s not enough for features to exist in training logs or the Feature Store — they also need to be present in the serving artifacts (like ANN indices) that L1 actually uses to serve traffic.
2. Embedding version skew: query vs. Pin
The second issue is specific to two‑tower architectures. Even when features are correct, the query and Pin towers may not be producing embeddings from the same model checkpoint.
- Offline, we typically evaluate under a clean, single‑checkpoint setup with one fixed model version for both towers, consistent features, and deterministic batch inference.
- Online, things move at different speeds: realtime enrichment writes fresh Pin embeddings into hourly indexing snapshots, query models roll on their own schedule, and for large tiers, index build plus deploy cycles can span days, so multiple embedding versions coexist in the same retrieval index.
The result is a natural amount of version skew: dot products between a query from version X and Pins whose embeddings may come from X, X–1, X–2, and so on.
To understand how much this mattered, we ran controlled sweeps where we:
- Fixed the query tower at a given version
- Varied the Pin embedding version across a realistic range
- Measured how loss and calibration changed across tiers and log sources
The takeaway was:
- For simpler, more stable model families, this skew caused some degradation but not enough to fully explain the online behavior
- For more complex variants (like DHEN), the same level of skew led to noticeably worse loss on some slices — large enough to materially drag down online performance compared to the idealized offline case
Instead of trying to completely eliminate skew (which is hard in a live system), we started treating it as a deployment constraint: for large tiers we favor batch embedding inference so each ANN build uses a single, consistent embedding version, and we require every new model family to go through explicit version‑skew sensitivity checks as part of model readiness.
Embedding skew by itself did not account for every aspect of the O/O gap, but it helped align our expectations: offline numbers came from a cleaner world than the one the model actually lived in online.
Beyond Prediction: Funnel and Metric Effects
Fixing features coverage and embedding skew closed most of the gap between “what we thought we were serving” and “what was actually running in production.” But we still had to answer a more systemic question:
What if the predictions are fine, but the rest of the system doesn’t translate them into CPA wins? Two concepts turned out to be especially important: funnel alignment and metric mismatch.
1. Funnel alignment
The ads funnel has multiple stages — retrieval, L1 ranking, L2 ranking, auction — each optimized under different constraints. An L1 model can be strictly better on its own metrics and still fail to move the overall system if the rest of the funnel is already close to its limits or is misaligned. To study this, we tracked:
- Retrieval recall: among final auction winners, how many came from the L1 output set?
- Ranking recall: among the top‑K candidates by downstream utility, how many appeared in the L1 output set?
Across multiple experiments, we saw cases where:
- Offline L1 metrics improved, but retrieval/ranking recall did not improve end‑to‑end, especially on surfaces that were already near their recall ceilings.
- Among several treatment arms with strong offline gains, only one or two produced clear online wins, which matched where recall actually moved.
This told us that beyond a certain point, L1 model quality is not the bottleneck — the funnel and utility design are.
2. Metric mismatch
We also had to internalize that offline and online metrics live in different regimes:
- Offline: LogMAE, KL, calibration, often using L2 predictions as teacher labels
- Online: CPA (our primary conversion metric), shaped by bids, budgets, pacing, and auction logic
Press enter or click to view image in full size
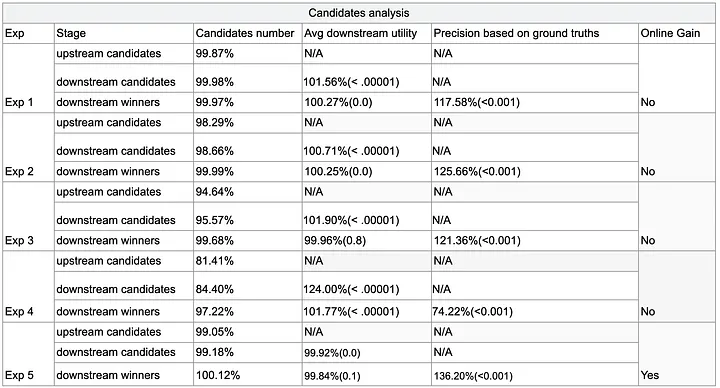
Table 1: Candidates analysis for Metric Mismatch Experiments
Replay analyses showed that:
- It’s possible to deliver more or better candidates by downstream utility and still not see the CPA movement you’d expect, once everything is filtered through real‑world auction behavior
This doesn’t mean offline metrics are useless — far from it. But they are necessary, not sufficient. You need to interpret them through the funnel and utility context they’re going to live in.
Conclusion: O/O as a Design Constraint
The big shift from this work is mindset: O/O discrepancy is not something you debug at the end; it’s something you design for from the start.
For L1 at Pinterest, that means:
- Model, embeddings, and feature pipelines are one system. We only trust offline wins after verifying that the serving stack is seeing the same world the model was trained in.
- The funnel sets the ceiling. Once recall and utility are saturated or misaligned, better L1 predictions alone won’t move CPA.
- Debuggability is part of the product. Coverage dashboards, embedding skew tests, and parity harnesses are as important to model velocity as the architecture itself.
By baking these ideas into our launch process, we’ve taken a frustrating blocker and turned it into a set of tools and habits that make future L1 experiments more predictable — and make it much easier to ship models that improve both offline metrics and real‑world outcomes.
Acknowledgments
We’d like to thank Xiao Yang, Peng Yan, Qingyu Zhou, Longyu Zhao, Li-Chien Lee, Fan Zhou, Abe Engle, Tristan Lee, Lida Li, Shantam Shorewala, Haoyang Li for their critical contributions to this analysis, and thank Jinfeng Zhuang, Zhaohong Han, Ling Leng, Tao Yang, Haoyang Li for their strong support and exceptional leadership.