Take OpenTracing for a HotROD ride

Photo by Trekphiler
Update (21 March 2019): my book Mastering Distributed Tracing has a newer version of this tutorial.
Update (July 2017): watch this demo live at OpenShift Commons Briefing.
OpenTracing is a new, open standard for instrumenting applications and OSS packages for distributed tracing and monitoring. In this post we explore the features and capabilities of OpenTracing using a demo application HotROD from Jaeger, a distributed tracing system recently donated by Uber Technologies to Cloud Native Computing Foundation. The presentation is structured as a walkthrough / tutorial showcasing how OpenTracing concepts can be applied in practice to monitor a microservices-based architecture and perform root cause analysis of performance issues. It also emphasizes the key feature of OpenTracing: being a vendor-neutral API, it allows other open source frameworks, such as those used for RPC, implement distributed tracing without locking themselves to a single vendor. The HotROD demo app’s source code contains no explicit use of the OpenTracing API around the RPC calls; instead all instrumentations comes for free from open source.
Prerequisites
- Introduce the HotROD app and its features.
- Use the tracing UI to understand the app’s architecture and data flow.
- Compare standard logs vs. OpenTracing logs.
- Identify sources of latency and errors in the call graph.
- Attribute time spent in the leaves of the call tree to information only available at the root of the tree via “baggage” propagation.
- Obtain RPC endpoint metrics without any additional instrumentation.
- Look at code examples of how each of the above features was achieved. Most of them come for free, i.e. without tedious manual instrumentation, because we use OSS frameworks already integrated with OpenTracing
We will be using an open source distributed tracing system Jaeger to collect and view the traces and analyze the application’s behavior. Let’s run Jaeger backend as an all-in-one Docker image (see up to date instructions):
docker run -d -p6831:6831/udp -p16686:16686 jaegertracing/all-in-one:latest
Once the container starts, open http://127.0.0.1:16686/ in the browser to access the Jaeger UI.
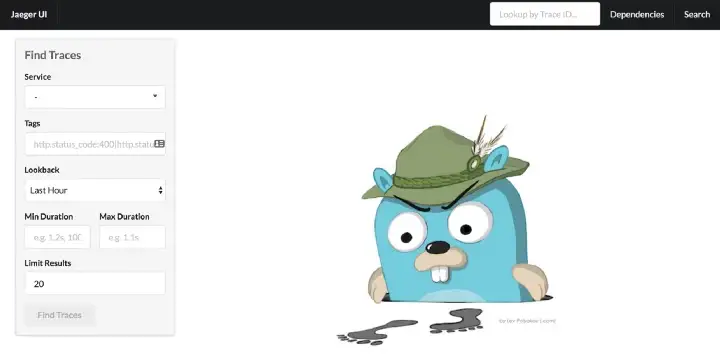
Jaeger UI front page, the Search screen.
The container runs the Jaeger backend with an in-memory store, which is initially empty, so there is not much we can do with the UI right now since the store has no traces. Let’s generate some traces using the HotROD app.
Meet the HotROD
HotROD is a demo “ride sharing” application. Let’s download and run it (see up to date instructions in its README):
git clone git@github.com:jaegertracing/jaeger.git jaegercd jaeger
go run ./examples/hotrod/main.go all
EDIT (2018–03–31): starting from version 1.3 the Jaeger project includes a Docker image for the HotROD example (see README), which is good for a quick test run of tracing the app, but in this post we will also be making small changes to the source code, so running from source is recommended.
The all command tells it to run all microservices from a single binary. In the logs written to standard out we can see these microservices starting several servers on different ports:
2017–05–03T23:53:19.693–0400 INFO cmd/all.go:31 Starting all services
2017–05–03T23:53:19.696–0400 INFO log/logger.go:43 Starting {“service”: “route”, “address”: “http://127.0.0.1:8083"}
2017–05–03T23:53:19.696–0400 INFO log/logger.go:43 Starting {“service”: “frontend”, “address”: “http://127.0.0.1:8080"}
2017–05–03T23:53:19.697–0400 INFO log/logger.go:43 Starting {“service”: “customer”, “address”: “http://127.0.0.1:8081"}
2017–05–03T23:53:19.697–0400 INFO log/logger.go:43 TChannel listening {“service”: “driver”, “hostPort”: “127.0.0.1:8082”}
Let’s navigate to the main service at http://127.0.0.1:8080:
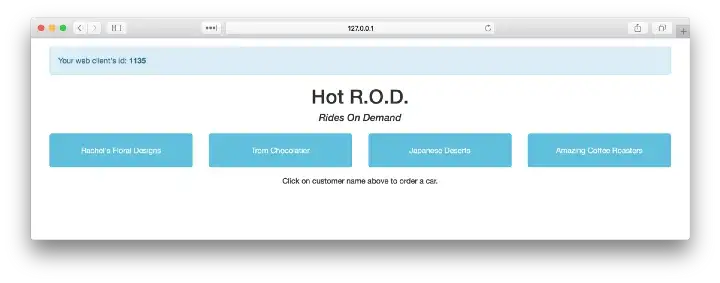
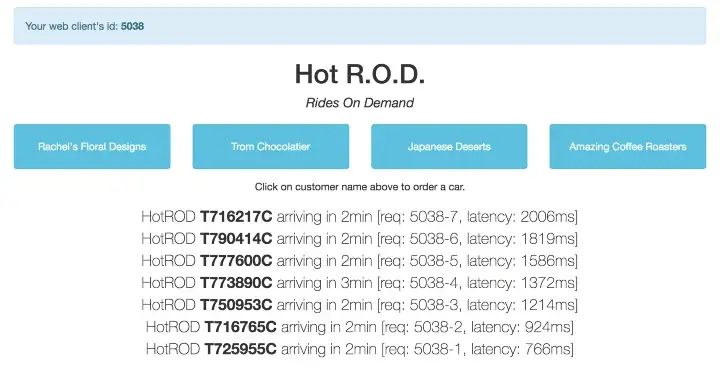
HotROD single-page web app
We have four customers, and by clicking one of the four buttons we summon a car to arrive to the customer’s location, perhaps to pick up a product and deliver it elsewhere. Once a request for a car is sent to the backend, it responds with the car’s license plate number and the expected time of arrival:
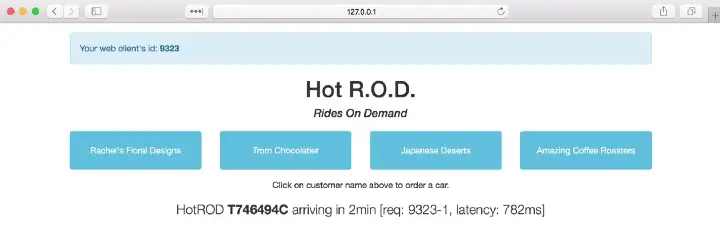
We ordered a car that will arrive in 2 minutes.
There are a few bits of debugging information we see on the screen.
- In the top left corner there is a
web client id: **9323**. It is a random session ID assigned by Javascript UI; if we reload the page we get a different session ID. - In the line about the car we see a request ID
req: **9323–1**. It is a unique ID assigned by Javascript UI to each request it makes to the backend, composed of the session ID and a sequence number. - The last bit of debugging data,
latency: **782ms**, is measured by the Javascript UI and shows how long the backend took to respond.
This additional information has no impact on the behavior of the application, but will be useful when we look under the hood.
The Architecture
Now that we’ve seen what the application does, we can ask how it is architected. After all, maybe all those servers we saw in the logs are just for show, and the whole app is simply a Javascript front-end. Rather than asking someone for a design document, wouldn’t it be great if Jaeger could build the architecture diagram automatically, by observing the interactions between the services? That’s exactly what Jaeger can do. That request for a car we executed had provided enough data. Let’s go to the Dependencies page, and click on the DAG tab:

Empirically constructed service dependency diagram
It turns out, the single HotROD binary is actually running four microservices and, apparently, two storage backends. The storage nodes are not actually real, they are simulated by the app as internal components, but the top four microservices are indeed real. We saw each of them logging a network address of the servers they run. The frontend microservice serves the Javascript UI and makes RPC calls to the other three microservices. The graph also shows the number of calls that were made to handle the single request for a car. E.g. the route service was called 10 times, and there were 14 calls to Redis.
The Data Flow
We have learned that the app consists of several microservices. What exactly does the request flow look like? It is time to look at the actual trace. Let’s go to the Search page in the Jaeger UI. Under the Find Traces caption, the Services dropdown contains the names of the services we saw in the dependency diagram. Because we know that frontend is the root service, let’s choose it and hit Find Traces.
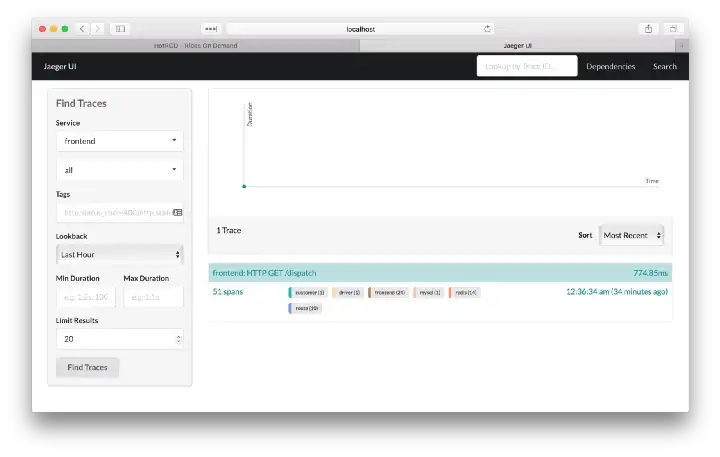
The first trace
The system found one trace and displayed some meta-data about it, such as the names of different services that participated in the trace, and the number of spans each service emitted to Jaeger. The top level endpoint name is displayed in the title bar: HTTP GET /dispatch. On the right side we see that the total duration of the trace was 774.85ms. This is shorter than 782ms we saw in the HotROD UI, which is not surprising, because the latter was measured from the HTTP client side by Javascript, while the former was reported by the Go backend. The 7.15ms difference between these numbers can be attributed to the network latency. Let’s click on the trace title bar.

Trace timeline view
The timeline view shows a typical view of a trace as a time sequence of nested spans, where a span represents a unit of work within a single service. The top level span, also called the root span, represents the main HTTP request from Javascript UI to the frontend service, which in turn called the customer service, which in turn called a MySQL database. The width of the spans is proportional to the time a given operation takes. It may represent a service doing some work or waiting on a downstream call.
From this view we can see how the application handles a request:
- The
frontendservices receives the external HTTP GET request at its/dispatchendpoint. - The
frontendservice makes HTTP GET request to the/customerendpoint of thecustomerservice . - The
customerservice executes an SQL SELECT statement in MySQL. The results are returned back to thefrontendservice. - Then the
frontendservice makes an RPC requestDriver::findNearestto thedriverservice. Without drilling more into the trace details we cannot tell which RPC frameworks is used to make this request, but we can guess it is not HTTP (it is actually made over TChannel). - The
driverservice makes a series of calls to Redis. Some of those calls are highlighted with pink background, indicating failures. - After that the
frontendservice executes a series of HTTP GET requests to the/routeendpoint of therouteservice. - Finally, the
frontendservice returns the result to the external caller.
If we click on any span in the timeline, it expands to show more details, including span tags, process tags, and logs. Let’s click on one of the failed calls to Redis:
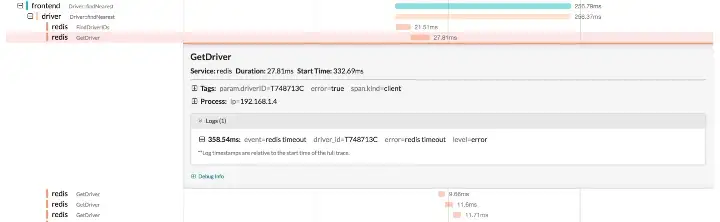
Expanded span details
We see that the span has a tag error=true, which is why the UI highlighted it as failed. We can also see that it has a log statement that explains the nature of the error as “redis timeout”. We can also see the driver_id that the driver service was attempting to retrieve from Redis.
Contextualized logging
We now have a pretty good idea about what the application does, if not exactly how it does it. For example, why does the frontend service call the /customer endpoint of the customer service? Of course, we can look at the source code, but we are trying to approach this from the point of view of application monitoring. One direction we could take is to look at the logs the app writes to stdout.

Typical logging output
It is quite difficult to follow the application logic from these logs. And we are only looking at the logs when a single request was executed by the application. Imagine many concurrent requests going through the system. The logs become nearly useless in that case. So let’s take a different approach. Let’s view the logs collected by the tracing system. For example, click on the root span to expand it and its logs.
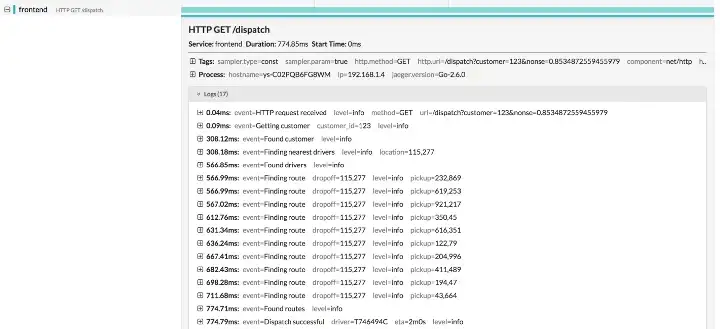
Logs recorded by the tracing system in the root span.
This view shows only the logs that happened during the execution of the root span. We call them contextualized, because they are captured in the context of a specific request and even specific span within the trace. We have seen earlier an error log from the timed-out Redis call. In the stdout it would’ve been mixed with a lot of other statements, but in the tracing system it is neatly isolated to the service and span where it was relevant. Contextualized logs allow us to drill into the behavior of the application without worrying about logs from other parts of the program or from other concurrent requests.
Span Tags vs. Logs
Let’s expand a couple more spans.

Tags and Logs
In the customer span we can see a tag http.url that shows that the request at /customer endpoint had a parameter customer=123. In the mysql span we see an sql.query tag showing the exact SQL query that was executed.
How do we decide if this data should go to span tag or span logs? The OpenTracing API does not dictate how we do it; the general principle is that information that applies to the span as a whole should be recorded as a tag, while events that have timestamps should be recorded as logs.
The OpenTracing specification repository defines semantic data conventions that prescribe certain well known tag names and log fields for common scenarios. Instrumentation is encouraged to use those names to ensure that the data reported to the tracing system is well defined and portable across different tracing backends.
Identifying sources of latency
So far we have not discussed the performance characteristics of the HotROD application. If we go back to the screenshot of the trace, we can easily make the following conclusions:
- The call to the
customerservice is on the critical path because no other work can be done until we get back the customer data, which includes the location to which we need to dispatch the car. - The
driverservice retrieves the 10 nearest drivers given the customer location and then queries Redis for each driver’s data in a sequence, which can be seen in the staircase pattern ofredis GetDriverspans. - The calls to the
routeservice are not sequential, but not fully parallel either; we can see that at most three requests can be in progress, and as soon as one of them ends another request starts. This behavior is typical when we use a fixed size executor pool.
What happens if we make many requests to the backend simultaneously? Let’s go to the HotROD UI and click on one of the buttons repeatedly (and quickly).
Executing many requests simultaneously shows increasing latency.
As we can see, the more requests are being processed concurrently, the longer it takes for the backend to respond. Let’s take a look at the trace of the longest request. We could do it in two ways. We can simply search for all traces and pick the one with highest latency, represented by the longest cyan-colored title bar.

Multiple traces returned in the search results.
Another way is to search by tags or logs on the span. The root span emits a final log where it records the winner driver ID as a field:

Driver ID recorded in the log field.
The Jaeger backend indexes all spans by tags and log fields, and we can find that trace by specifying driver:T716217C (no spaces) in the Tags search box:

Searching for trace by tags
Let’s open this long, 1.8sec trace and compare it with the 700ms trace we saw earlier.

High latency trace.
The most apparent difference is that the mysql span takes a lot longer than before, 1.37s instead of 305ms. Let’s expand that span and try to find out why.
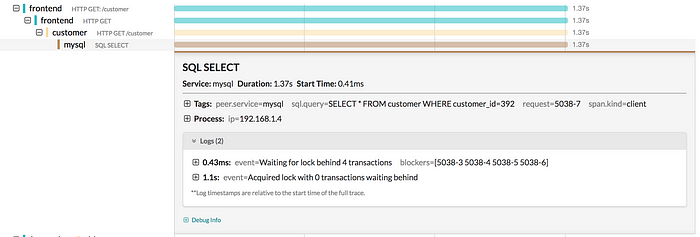
Inspecting very long mysql span.
In the logs we see that execution was blocked waiting for a lock for over a second. This is clearly a bottleneck in the application, but before we dive into that let’s look at the previous log record, evidently emitted before getting blocked on the lock. It tells us how many other requests were already queued for this lock, and even gives us the identity of those requests. It is not too hard to imagine a Lock implementation that keeps track of how many goroutines are blocked, but where would it get the identity of the requests? If we expand the previous span for the customer service, we can see that the only data passed to it via HTTP request was the customer ID 392. In fact, if we inspect every span in the trace we will not find any remote call where the request ID like 5038–3 was passed as a parameter.

Customer 392 is the only info passed by the caller.
This “magic” appearance of concurrent request IDs in the logs is due to a feature of the OpenTracing standard called baggage. Distributed tracing works because certain meta-data is propagated across thread and process boundaries, throughout the whole call graph, by the tracing instrumentation using the OpenTracing API. One example of such meta-data is trace and span IDs. Another example is baggage, which is a general key-value store embedded in every inter-process request. HotROD’s Javascript UI stores session ID and request ID in the baggage before making the request to the backend, and that baggage is made available to every service involved in handling the request, without the need to pass that information explicitly as request parameters. It is an extremely powerful technique that can be used to propagate various useful information (e.g. security tokens) in the context of a single request throughout the architecture, without needing to change every service to understand what they are propagating. The Pivot Tracing project shows fascinating examples of using baggage for dynamic monitoring.
In our example, knowing the identities of the requests stuck in the queue ahead of our long tail request allows us to find traces for those requests and analyze them as well. In real production systems this could lead to the unexpected discovery of a long running request spoiling a lot of other requests that are normally very fast. Later we will see another example of using baggage.
Now that we know that mysql call gets stuck on a lock, we can easily fix it. As we mentioned earlier, the application does not actually use MySQL database, just a simulation of it, and the lock is meant to represent a single database connection shared between multiple goroutines. We can find the code in the file examples/hotrod/services/customer/database.go:
// simulate misconfigured connection pool that only gives// one connection at a timed.lock.Lock(ctx)
defer d.lock.Unlock()
// simulate db query delay
delay.Sleep(config.MySQLGetDelay, config.MySQLGetDelayStdDev)
Notice how we pass the ctx parameter to the lock object. context.Context is a standard way in Go to pass request-scoped data throughout the application. The OpenTracing span is included in the context, which allows the lock to inspect it and retrieve the Javascript’s request ID from the baggage.
Let’s comment out the lock statements, to pretend that we fixed the code to use a connection pool with enough capacity that our concurrent requests do not have to compete for connections. And let’s also decrease the delay config.MySQLGetDelay (in services/config/config.gofile) from 300ms to 100ms, then restart the HotROD app and repeat the experiment.

Improved latency after fixing mysql bottleneck.
The latency still increases as we add more requests to the system, but it no longer grows as dramatically as with the single mysql bottleneck before. Let’s look at one of the longer traces again.

Trace after removing mysql bottleneck
As expected, the mysql span stays at around 100ms regardless of the load. The driver span is not expanded, but it takes the same time as before. The interesting change is in the route calls, which take more than 50% of the total request time. Previously we saw these requests executing in parallel three at a time, but now we see periods without even a single request running. Clearly, we have contention with other goroutines on some limited resource. And we can also see that the gaps happen between the spans of the frontend service, which means the bottleneck is not in the route service, but in how thefrontend service calls it. Let’s look at the code in file services/frontend/best_eta.go, function getRoutes():
// getRoutes calls Route service for each (customer, driver) pairfunc (eta *bestETA) getRoutes( ctx context.Context, customer *customer.Customer, drivers []driver.Driver,) []routeResult { results := make([]routeResult, 0, len(drivers)) wg := sync.WaitGroup{} routesLock := sync.Mutex{} for _, dd := range drivers { wg.Add(1) driver := dd // capture loop var // Use worker pool to (potentially) execute // requests in parallel eta.pool.Execute(func() { route, err := eta.route.FindRoute(ctx, driver.Location, customer.Location) routesLock.Lock() results = append(results, routeResult{ driver: driver.DriverID, route: route, err: err, }) routesLock.Unlock() wg.Done() }) } wg.Wait() return results
}
This function receives a Customer record (with address) and a list of Drivers (with their current locations), and calculates the ETA for each driver. It calls the route service for each driver using an executor pool. So as long as we have enough executors in the pool we should be able to run all calculations in parallel. The size of the executor pool is defined in services/config/config.go:
RouteWorkerPoolSize = 3
The default value of 3 explains why we saw at most three parallel requests in the very first trace we inspected. Let’s change it to a 100 (remember that goroutines are cheap), restart HotROD, and rerun the test:

Latency results after fixing worker pool bottleneck
We have to click on the buttons really fast now, because the requests return back in less than half a second.

Trace after fixing worker pool bottleneck
And as expected, the calls from frontend to route service are all done in parallel now, thus minimizing the overall request latency.
We leave the final optimization of the driver service as an exercise for the reader.
Resource Usage Attribution via Baggage
This sounds a bit boring, but comes up in large organizations all the time when they try to improve the efficiency of, say, their hardware usage (disk, CPU, etc). There is often a need to measure resource usage and attribute it to some high level business parameter. For example, the calculation of the shortest route performed by the route service is a relatively expensive operation (probably CPU intensive) . It would be nice if we could calculate how much CPU time we spend per customer. However, the route service is farther down the dependency tree from the point where we know about the customer, and it does not need to know about the customer in order to calculate the shortest route between two points. Passing the customer ID to the route service just to measure CPU usage would be bad API design. This is where tracing and baggage come into play. In the context of a trace, we know for which customer the system is executing the request, and we can use baggage to transparently pass that information throughout the architecture without changing all the services to accept it explicitly. And if we want to perform CPU usage aggregation by some other parameter, say the session ID from the Javascript UI, we can do it without changing the app as well.
To demonstrate this approach, the route service contains the code to attribute the CPU time of calculations to the customer and session ID which it reads from the baggage. In the services/route/server.go file we can see this code:
func computeRoute( ctx context.Context, pickup, dropoff string,) *Route { start := time.Now() defer func() { updateCalcStats(ctx, time.Since(start)) }() // actual calculation
}
As before, we don’t pass any customer / session ID because they can be retrieved from baggage via the context. The updateCalcStats function uses the expvar package from Go’s standard library to accumulate and present the results.
var routeCalcByCustomer = expvar.NewMap( "route.calc.by.customer.sec",)var routeCalcBySession = expvar.NewMap( "route.calc.by.session.sec",
)
var stats = []struct { expvar *expvar.Map baggage string}{ {routeCalcByCustomer, "customer"}, {routeCalcBySession, "session"},
}
func updateCalcStats(ctx context.Context, delay time.Duration) { span := opentracing.SpanFromContext(ctx) if span == nil { return } delaySec := float64(delay/time.Millisecond) / 1000.0 for _, s := range stats { key := span.BaggageItem(s.baggage) if key != "" { s.expvar.AddFloat(key, delaySec) } }
}
If we navigate to http://127.0.0.1:8083/debug/vars, we can see route.calc.by.* entries that give us the breakdown of time (in seconds) spent in the calculation on behalf of each customer and some UI sessions.
route.calc.by.customer.sec: { Amazing Coffee Roasters: 1.479, Japanese Deserts: 2.019, Rachel's Floral Designs: 5.938, Trom Chocolatier: 2.542},route.calc.by.session.sec: { 0861: 9.448, 6108: 2.530
},
How Do We Instrument with OpenTracing
This question is a topic for another blog post, but it is worth pointing out that there is not a lot of OpenTracing instrumentation in HotROD source code itself. For example, the driver service exposes a TChannel server, created like this:
// NewServer creates a new driver.Serverfunc NewServer( hostPort string, tracer opentracing.Tracer, metricsFactory metrics.Factory, logger log.Factory,) *Server { channelOpts := &tchannel.ChannelOptions{ Tracer: tracer, } ch, err := tchannel.NewChannel("driver", channelOpts) if err != nil { logger.Bg().Fatal("Cannot create TChannel", zap.Error(err)) }
server := thrift.NewServer(ch)
The only line related to OpenTracing is passing the tracer in the options. The function implementing the endpoint does not have any reference to OpenTracing either (services/driver/server.go):
// FindNearest implements Thrift interface TChanDriverfunc (s *Server) FindNearest( ctx thrift.Context, location string,) ([]*driver.DriverLocation, error) { s.logger.For(ctx).Info("Searching for nearby drivers", zap.String("location", location))
driverIDs := s.redis.FindDriverIDs(ctx, location)
This is because TChannel, an open source framework, directly integrates with OpenTracing, another open source framework. When we create an application, we just need to instantiate a concrete Tracer and pass it in.
We can see a similar lack of instrumentation in the HTTP endpoints. In fact, the only place the OpenTracing instrumentation is used explicitly is in the functions that simulate Redis and MySQL, because there we are not actually making any RPC requests over any framework.
What About Vendor Neutrality
We stated in the beginning that applications instrumented with OpenTracing avoid vendor lock-in to a specific tracing backend. We leave it as an exercise to the reader to try collecting traces from HotROD into another tracing system, such as Lightstep or Appdash. The only place in the application that needs to change is the Init function in pkg/tracing/init.go:
// Init creates a new instance of Jaeger tracer.func Init( serviceName string, metricsFactory metrics.Factory, logger log.Factory,) opentracing.Tracer { cfg := config.Configuration{ Sampler: &config.SamplerConfig{ Type: "const", Param: 1, }, Reporter: &config.ReporterConfig{ LogSpans: false, BufferFlushInterval: 1 * time.Second, }, } tracer, _, err := cfg.New( serviceName, ) if err != nil { logger.Bg().Fatal( "cannot initialize Jaeger Tracer", zap.Error(err), ) } return tracer
}
What About Logging
We saw that the traces contain contextualized logs from the application. How do they get to the tracing backend? Does the code need to call log methods on OpenTracing Spans directly?
In the FindNearest function above we see an example of the log statement:
s.logger.For(ctx).Info( "Searching for nearby drivers", zap.String("location", location),
)
The expression zap.String(k, v) is the structured logging API supported by a fast logging library for Go called Zap (https://github.com/uber-go/zap), so there’s nothing specific to OpenTracing here. The trick we are using in HotROD is a wrapper around Zap logger that does not expose normal logging methods. Instead it provides two methods:
For(context.Context)returns a contextualized logger for request-scoped logs;Bg()returns a background logger for logging events that are not scoped to a request, such as application start-up sequence.
Accessing a contextualized logger always requires a Context object. Once we have the context object, all normal log methods can be delegated not only to the regular logger, but also translated into the calls to the logging methods on the Span. The source code can be found in pkg/log/spanlogger.go, e.g.:
func (sl spanLogger) Info(msg string, fields ...zapcore.Field) { sl.logToSpan("info", msg, fields...) sl.logger.Info(msg, fields...)
}
OpenTracing Is Not Just for Tracing
We have seen how tracing can take on the role of a log aggregation system by presenting the logs in the context of the respective tracing spans, while not requiring the application to use a separate logging API. What about another critical piece of monitoring for microservices, collecting metrics about RPC endpoints? It turns out that instrumentation using the OpenTracing API is often a superset of instrumentation people use to monitor RPC endpoints. The most common measurements for RPC are request counts, error counts, and distribution of request latencies. OpenTracing instrumentation already captures all these signals and can emit metrics without additional instrumentation.
The Jaeger tracer for Go has an option to emit metrics for RPC, which is enabled in the HotROD demo. If we go back to the expvar endpoint http://127.0.0.1:8083/debug/vars, we can see various metrics collected for all endpoints in the application.
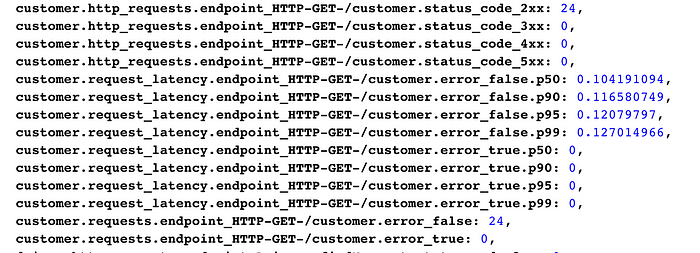
RPC metrics for /customer endpoint
For example, we can see that there were 24 successful requests to the /customer endpoint and zero errors. The expvar’s /debug/vars endpoint is a somewhat primitive way to display RPC metrics, so here is another example from Uber’s internal dashboard. All these metrics are emitted by OpenTracing instrumentation and the Jaeger tracer.

Example of charting metrics emitted by Jaeger tracer
Conclusion
In this article we reviewed practical examples of the following OpenTracing features:
- Off the shelf instrumentation & vendor neutrality
- Monitoring transactions spanning many microservices
- Measuring latency of operations
- Root cause analysis with span tags and logs
- Contextualized span logs
- Baggage propagation
- Automatic generation of RPC metrics
The source code for the demo, as well as the Jaeger backend, is on GitHub: https://github.com/uber/jaeger. If something in this tutorial does not work, please open an issue.