Garbage Collection Optimization in Promise Engine
Authors:
,
Valuable Contributions:
,
Background
If you have used the Myntra app to purchase a product, you would normally browse the product on the search page and select it to get the details. This action takes you to the product detail page where complete information about the product such as attributes, images, etc is shown.
Along with this information, you will also see whether that specific product can be delivered to the Pincode specified and what time it will take to get it delivered.

The product can’t be delivered to Pincode 793106

The product can be delivered to Pincode 560068 with the delivery date of 14th March
Promise engine is the service that powers this information. It is a tier 1 service that provides information about Serviceability and Promise.
Serviceability: Whether a product on Myntra can be delivered to customer Pincode
Promise: The time it will take to deliver the product to the customer
Multiple storefront services call it to get this information in real-time which makes it a very critical service. This service gets a varied load which ranges from 10K-40K RPM per server and p99 is expected to be below 50ms. Also, the service level agreement states that the request timeout set by the storefront clients is very strict(400ms) so our p99.5 and p99.9 should be bounded, or else it will result in frequent request timeouts.
Problem
Promise engine uses network configurations to come up with the details that a product can be delivered to a customer’s Pincode. These raw configurations are stored in a relational database. The application preprocesses this data and creates simplified objects called digests which are used by promise APIs to calculate the response. These digests are stored in the Redis cluster. To optimize the performance further, the application stores some of these digests in application memory where EHCache is used as an In-memory caching solution. These EHCaches have a predefined TTL with the LFU(Least Frequently Used) eviction policy. Since these objects are part of application heap memory they play an important role in governing GC cycles.

Datastore Model for Promise Engine
The application started facing an issue where latency spikes were observed every couple of hours. This was resulting in periodic request timeouts on the client side. Initial investigations pointed out that GC cycles caused it. The old generation was filling up, causing stop-the-world(Major GC) cleanup, which affected the application performance. We started to look for solutions to prevent it for both BAU and HRD loads.
BAU: business as usual
HRD: high revenue days

JVM Old generation Heap filling every couple of hours
Understanding GC in Simple terms
Garbage Collector is an automated memory management system. “Garbage” refers to unreferenced objects in memory. GC reclaims space occupied by garbage objects and makes it available for further allocation. There are 3 major steps in the GC algorithm.
Mark: Marks all live objects as referenced and unreferenced
Sweep: Reclaims space from unreferenced objects
Compact: Sweep can result in fragmentation. This step moves around the objects to use contiguous memory and make space for bigger memory chunks.

Typical heap lifecycle
There are multiple GC algorithms for memory management. Here we will talk about the generational G1GC algorithm that was used in our service.
G1GC divides the heap into 2048 regions and cleans the region with the highest garbage concentration first. The heap is segregated into 2 regions, Young Generation and Old Generation. We will refer to these generations in the rest of the post as defined below:
Young Generation: YG
Old Generation: OG
YG comprises 3 partitions that are:
Eden: Heap memory is allocated in this partition
Survivor1 or S1: Live objects move here from Eden and S2 after sweep and compaction
Survivor2 or S2: Live objects move here from Survivor1 and Eden after sweep and compaction
S1 and S2 act as swap spaces for compaction.
OG partition will have objects that are long-lived and have survived a threshold of YG GC cycles or objects will be moved to OG if survivor space cannot hold all the survived objects.

Heap Division in G1GC
A few definitions will be used frequently later.
Tenuring Threshold: When a live object survives for several cycles equal to the tenuring threshold, it is moved to old generation space. The value of the max Tenuring Threshold can be 1 to 16(default 15) but the threshold is determined at runtime by GC depending on the survivor’s size.
InitiatingHeapOccupancyPercent(IHOP): Sets the Java heap occupancy threshold that triggers a marking cycle. The default occupancy is 45 percent of the entire Java heap.
Object Movement with G1GC cycles
The animation below shows the object movement in a typical G1GC cycle. The pink color represents an unreferenced object and the light green color represents a live object in each mark, sweep, and compact cycle. The count mentioned in the bracket with object id represents the total survival cycle count. Tenuring threshold is considered as 3 here.

GC cycles and object movement with tenuring threshold 3
When the entire heap is filled up, a full GC cycle starts. It runs mark, sweep, and compact for all regions. All application threads would be frozen till the completion of full GC which can have a serious impact on latency and throughput.
Solution
GC optimizations and improvements to managing In-memory cache(EHCache) objects
Preliminary Analysis
- No memory leaks. Even though objects are moving to OG, they are being released in a major GC cycle and thus not crashing the app.
- GC Used: G1GC
- GC params used:
- MaxGCPauseMillis=100
- InitiatingHeapOccupancyPercent=70
- NewSize=10g
4. Heap Size: 16GB
Iteration summary

Iteration 1: Identification and eviction of Objects moving to OG
Heap dump analysis showed that the majority share were objects referenced by EHCache. A negligible amount of newrelic and tomcat objects were referenced as well.
GC frequency at BAU load was about 3 minutes and with a max tenuring threshold of 15 (default), any object should be held 15 * 3 = 45 minutes for it to move to old gen space, but the longest TTL in EHCache is only 15 minutes. According to this configuration, EHCache objects should be cleaned up after TTL expiry and should never move to OG.
On further investigation, it was found from EHCache’s official document, that elements are lazily expired only when necessary (either through LFU eviction when the EHCache size limit is reached or when an expired element is accessed), due to which the elements were moving to OG. This was not helping us as a new value was retrieved from Redis after the expiry. EHCache exposes a method called evictExpiredElements, which we used to evict elements periodically.
After this change, OG was stable at BAU load. No spikes in RT but the same issue of OG buildup is observed at the HRD load. At 40K RPM, the object creation rate is very high and thus Minor GCs happen very frequently, like every 8 seconds or so. Anything cached above 8 * 15(tenuring threshold)= 120s would be promoted to OG space. Since our EHCache TTL is 15 minutes, every object cached in EHCache would move to OG.
Iteration 2: Reduce the rate of object creation to decrease GC frequency
Bytes and strings are the most allocated objects on our heap, and string lists from our digest object were repeated. Map objects were created by reading real-time data from Redis and occupied 30% of the heap.
Native caching of courier code strings in java string pools and caching of a single courier list reduced the size of EHCache on the heap. Along with this heap size was increased to 24GBThe duration between GCs came down to around 22–25s, so objects could be cached for up to 5 minutes now without any OG buildup. Though this works if EHCache TTL is reduced to 5 minutes, it was not sustainable, as:
- Changing the EHCache size, duration, or scale creates the same problem again, as the buffer is too small to stop OG from filling up.
- Reducing EHCache TTL to 5 minutes from 15 minutes would mean a 3x load on the Redis cluster.
Iteration 3: Explore non-generational GC algorithms
G1GC is generational GC, which means that objects need to be moved between generations and treated differently. ZGC is what we exactly need in theory. It’s fully concurrent, works for large heaps, and keeps GC pauses under 10ms.
The GC algorithm was changed to ZGC and was tried with 2 versions of java, jdk11, and jdk15. It worked great and solved all our problems. p99 was well under 50ms throughout the test without any spikes.
ZGC version of Java 11 was unstable and crashed after an hour or so, and it was in the experimental stage so future support was not planned. It was a feature release in Java 15 and most major bugs are already fixed, however, the application still crashed after 8 hours. Since this was still in the beta phase it could not be used in production. We decided to stick with G1GC and explore other parameters.
Iteration 4: Mixed GC
Mixed GC runs collect marked objects from OG and YG in the same run. If OG space is cleared periodically with YG cycles then major GC can be avoided. IHOP parameter was tuned to achieve this. Initially, IHOP was set to 70%, YG was 10GB and OG was set to 6GB. This means that mixed GC collections will happen when the total heap is filled up to 11.2GB. The application never reached this threshold as Minor GCs cleared enough YG space. This led to a complete fill-up of OG and major GC runs were triggered.
To trigger mixed GC**, IHOP percentage was reduced to 15%**. Voila!!! No more major GC cycles in BAU and HRD load as well. Mixed GCs collected part of OG whenever it filled up.
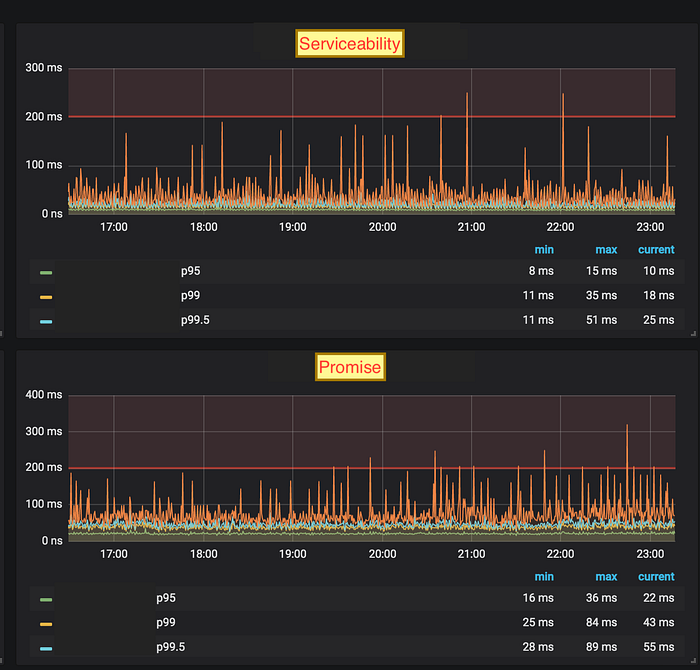
- No major GC, and spikes in p99 are completely gone.
- There are 400ms spikes in p99.9 occasionally for BAU load.
Iteration 5: Optimising GC parameters for BAU load
Though the response times were spike-free and consistent for high loads, BAU load showed lots of small 400ms spikes in p99.9.

p99.9 spikes only in BAU
These spikes were consistent with minor GC times. Further, minor GC times were directly correlated to the size of the survivor space. GC happens every 8 minutes, which means there would be at least half the size of EHCache (~2GB) surviving every cycle as the TTL is 15 minutes.
Our heap size distribution was optimized for high load. YG needs to be smaller in BAU, so GCs can happen frequently, thus fewer survivors and short GC pauses. Fixed sizing of heap space was removed (NewSize) and dynamic sizing was allowed according to the load. Other than permanent app objects, EHCache elements are the only one that is retained for more than one GC cycle. So, if there are survivors for more than 3 GC cycles, it is better to promote such objects to OG to clean up survivor space. To achieve this the tenuring threshold was set to 3. (MaxTenuringThreshold)
This worked great and the spikes were less than 150ms-200ms in the BAU load and there was no change at high load. Also, the application was able to respond efficiently to sudden bursts in load, as long as the cache was warmed up.
p99.9 bounded in BAU mode after removing fixed size
There was no additional overhead in CPU utilization due to the auto-resizing of generations for varying loads but GCs became frequent at BAU load, which resulted in frequent p99.9 spikes though bonded as observed in the above graph.
To tackle these p99.9 spikes GC pause time was reduced to 50ms (MaxGCPauseMillis). Now, p99.9 spikes were under 100ms for BAU load and no change in performance at high load. The collection cycle was still efficient.
Finally, acceptable results ?. Ironically, our performance at high RPM is better than at low RPM, but both were in acceptable ranges.
Final Result
40K RPM
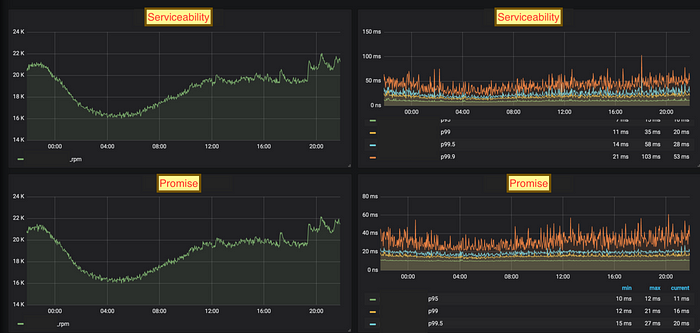
Latencies with HRD load
BAU Load Performance
5K RPM
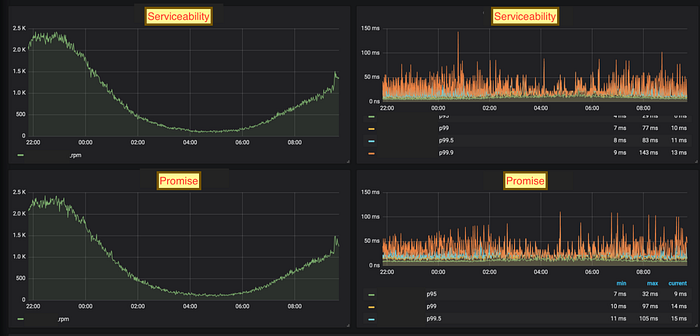
Latencies with BAU load
Migration to jdk16 with the same set of parameters worked well for us without any changes. ZGC was also tried with jdk16 but G1GC with optimized parameters was performing better for our application.
Conclusion
A standard set of GC parameters will not work for every application. Arriving at the right parameter requires multiple iterations and an understanding of the application memory and object creation behavior with varied load and tuning accordingly. In case our application is using In-memory caches, object management should be optimized for that. Also, GC parameters should be set to serve varied traffic efficiently. Changing these parameters with a traffic pattern is not feasible.
Tools Used: Eclipse heap dump analyzer, Flamegraph, Grafana, Newrelic, Java Memory Histograms