A/B Tests for Lyft Hardware
By Garrett Drayna, CJ Chen, and Mark Schulte
A/B tests, controlled experiments to measure performance differences between groups, are ubiquitous tools in data science and represent the gold standard in business measurement. At Lyft, A/B tests are found in nearly every product, from measuring the performance of marketplace algorithms and app designs, to engineering infrastructure changes. The units of analysis for most A/B tests are users, and sometimes markets or times of day. In this post, we are going to describe a new type of A/B test we are performing on our hardware team at Lyft. We will also illustrate a couple of A/B tests which we have done to safely and confidently improve the user experience, lower costs, and provide the best possible service for the cities in which we operate.

Figure 1: Lyft’s first generation dockless eBike
Lyft’s TBS (Transit, Bikes, and Scooters) team is the largest bike sharing network in North America (Citi Bike, Divvy, and Bay Wheels to name a few systems), and runs scooters and transit products integrated into the Lyft app. TBS currently operates four classes of hardware products in many of America’s largest cities — electric and non-electric bikes, electric scooters, and parking stations. Lyft TBS designs, builds, operates, and maintains its own hardware. Our teams of hardware engineers, product managers, data scientists, and others are constantly improving and refining our existing hardware products in addition to designing totally new products.
Figure 2: Testing and experiments throughout the hardware lifecycle
Hardware organizations, Lyft included, typically have a thorough process for testing products during design and manufacture but that is where it typically ends. Since Lyft both owns and operates its own hardware and has an established culture and infrastructure for data science, it is in a unique position to perform in-market testing in addition to the other traditional steps. For example, to answer such questions as: how well does a new version of firmware perform, or how do our users react to different power levels of our e-bikes, and just how much power do they consume? But first, we needed to figure out how to run A/B tests for hardware.
The most common types of A/B tests run at Lyft are user-split and time-split experiments. Lyft has powerful internal A/B testing tools to streamline or even automate parts of the testing process, and handle these types of A/B tests. Lyft users use the hardware like the app, so why not split the experiment on users? User split tests are ideal for measuring a user’s reaction to product features and many of our questions are around user reactions, so it seems like a natural fit, right?
Not so fast. The nuance here is that we need to measure both hardware performance in the real world, and a user’s reaction to it. Or, we may be interested in pure hardware performance, such as verifying the performance of a new release of firmware (embedded software).
Do we have enough sample to make this work?
Lyft currently operates approximately 10,000 to 20,000 active IoT-connected bikes and scooters. While this may seem like a sizable number, it’s quite small compared to many Lyft user split tests, which may see hundreds of thousands of users exposed. Will we have enough statistical power?
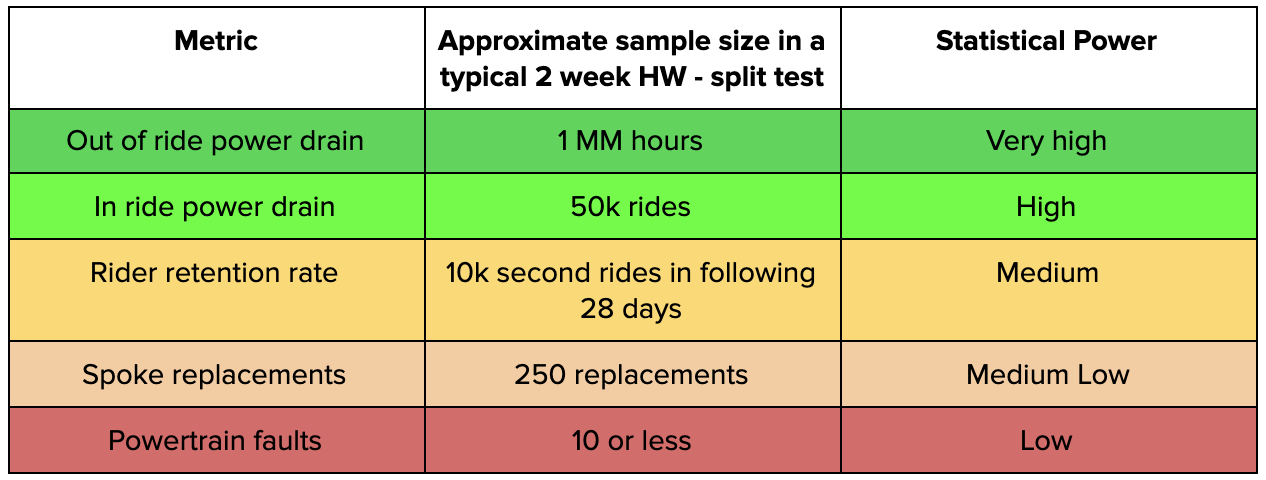
The perhaps counterintuitive answer is yes, but — there is a spectrum. Many hardware tests will measure ride-level metrics (e.g., conversion, ride rating). Variance in these metrics for hardware tests is driven by ride-to-ride variation. Additionally, rider mass, rider drive cycle, route choice, and other UX elements will drive power drain and mechanical stress on vehicles. This means we will have on the order of O(rides) samples for these metrics. On the opposite end of the spectrum are faults and rare failures. These may occur in a tiny fraction of rides or not at all.

Table 1 — Effective statistical power for a sampling of metrics in a two week, 2000 bike — split test.
A warm-up: firmware releases with A/B testing
To figure out how we would build A/B tests for hardware, we first tackled a ‘warm-up’ problem, augmenting our embedded software QA process with in-field measurements of firmware performance. Lyft uses over-the-air (OTA) firmware updates to change the code on vehicles remotely with no human intervention. Every two weeks, we integrate new features, bug fixes, refactors, etc. into our vehicle code, test it, and update the vehicles in the field. We accomplish several key things by A/B testing performance of a new firmware release relative to existing releases:
- We can catch rare or ‘field only’ bugs that QA testing may not find.
- Engineers can verify that bug fixes work in the field by instrumenting specific errors or faults.
- We can measure the business impact or user impact of sets of code changes or specific features which we can’t or don’t want to test separately.
This was a great candidate to try our hand at building and running our first hardware-split A/B tests at Lyft. As we started, we found that firmware release A/B testing at Lyft took a couple of key steps:
- Configuring our experiment platform to send and track variants according to vehicle ids instead of user ids.
- Building control firmware to use variables in Lyft’s targeted configuration service. This pushes a new firmware OTA to the devices in the treatment group.
- Marking exposures when the vehicle confirms back to the server that it is running the new firmware version.
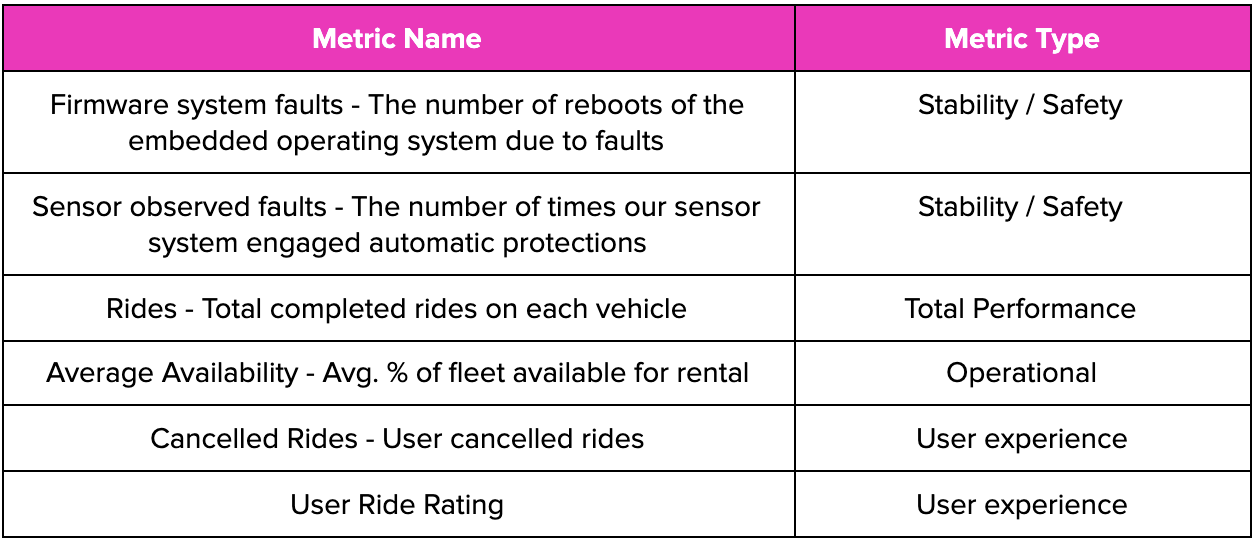
- Building experiment metrics of interest for firmware releases. A couple of key metrics we built are in Table 2.

Table 2 — Metrics for A/B testing firmware releases
Hardware Feature A/B Testing
The ‘ideal’ type of hardware A/B test to perform is tuning and isolating the performance of a single feature. To do this, we built a system to pass variables (aka “feature flags”) from our targeted configuration service directly to the firmware itself. We don’t need to rely on a device successfully updating it’s operation system, or hardcoded values in a firmware version. Instead we can parameterize key variables of interest and test the performance of those different values.
Let’s remember our earlier assertion about why we test hardware and not users — because we need to know hardware performance first, and then user reactions second. In hardware split tests, users may see different variants if they take rides on multiple different vehicles. So how do we also measure user reactions? We run two consecutive experiments, one real hardware-split test, and one synthetic user-split test.
In our real experiment, we measure hardware performance and time-of-ride user metrics like ride-rating and cancelled rides. In our synthetic test, we match users who saw different variants to similar users who only saw the control via propensity score modeling. With this synthetic control group, we can measure longer term user metrics like retention and churn. This allows us to perform a full business trade off. Are any hardware performance changes worth any associated changes to the user experience?
A recent experiment we ran exemplifies this well: Should we put our locking peripherals in sleep mode when not in ride?
Figure 3: A rendering of the dockless eBike fender and cable lock module. Putting this module into a low power mode when not in ride significantly improved our need for swapping fresh charged batteries onto the bike in a hardware-split A/B test.
The context for this experiment was:
- We can save battery by putting our battery lock and cable lock modules in a sleep mode. However, when a user initiates a ride, the bike beeps to acknowledge the ride, but the cable lock takes 1–2 seconds to wake up and release. This would double our end-to-end latency. We need to verify benchtop electrical power-saving experiments in the field and measure if the extra latency adds too much UX friction.
Our hypothesis was:
- We will realize power and ops costs savings as predicted by engineering design-based estimates without impacting the UX
What we measured was fascinating (data altered but directionally correct):
- Out of ride power draw: -25%
- Number of battery swaps required: -17% (Major operational cost savings)
- Average ride rating: -1%
- Unlocked bikes in the field: +30%
- No change in long term rides or user retention.
This is the power of A/B testing. We validated that this change would save a significant amount of power and optimize our battery swapping operations. However, we also uncovered a firmware bug resulting in a (small but significant) increase in unlocked bikes in the field. Additionally, we see that users may have experienced a small amount of additional friction in their experience. We ended up fixing the bug and launched this experiment to all dockless e-bikes. Ultimately, this isn’t enough to change how often they use our service, but we want to carefully track this and continue to deliver the best ride experience we can.
With A/B testing of hardware features, we are working on answering several key questions for our business. For example: eAssist has completely changed bike commuting, and our users greatly prefer e-bikes over pedals when given the choice. But, there is nuance to this decision :
- Just how much eAssist is the right amount for our users?
- Should we be providing high power, high torque motors that provide a good kick but are heavy and use more energy?
- Or, is it better to provide a gradual assist to keep users from breaking a sweat while also reducing the charge used and keeping our operation more environmentally and economically sustainable?
We have done extensive powertrain simulations, but we need to confirm how this works in the real world. We also hope to look at on-vehicle features and UX, maintenance optimization, and many more. With A/B testing for hardware, we can deliver the best vehicles for our users, at the best price, and with the best performance for our cities.
Interested in using science to inform hardware decisions? Check out our current job openings!