What happens when your distributed service has challenges with stampeding herds of internal requests? How do you prevent cascading failures between internal services? How might you re-architect your workflows when naive horizontal or vertical scaling reaches their respective limits?
These were the challenges facing Slack engineers during their day-to-day development workflows in 2020. Multiple internal services that engineers used were stretched to their limits, leading to cascading failures between services. Cascading failures are positive feedback loops where one part of the system fails at scale, leading to a queue in an adjacent system that results in another system failing due to scale. For several years, internal tooling and services struggled to keep up with 10% month-over-month growth in CI/CD requests from a combination of growth in 1) internal headcount and 2) complexity of services and testing. Development across Slack slowed due to these failures, leaving internal tooling and infrastructure engineers scrambling to restore service. Engineers managed to restore service in the short-term by…
- Scaling appliances like Github Enterprise to the largest hardware available at the time in AWS (limiting future vertical scaling).
- Scaling one service with more nodes to handle a new peak load (only to discover that this led to failures in another service in the infrastructure).
Of course, these solutions would only work until we reached a new peak load in internal services. We needed a new way to think about this problem.
This article describes how Slack engineers increased developer productivity by implementing orchestration-level circuit breakers throughout internal tooling at Slack. Engineers across Developer Productivity teams at Slack applied friction to defer or shed requests in Checkpoint, a Continuous Integration (CI) / Continuous Delivery (CD) orchestration service.
Complexity and scale challenges in CI/CD orchestration and Webapp
Let’s go back to 2020. We saw two classes of interrelated problems: scale and complexity.
Early in Slack’s history, engineers built and used CI for development and CD for deploying and releasing Slack to production. Checkpoint is our internal platform to orchestrate code builds, tests, deploys and releases. Over time, Slack grew in the number of developers and feature releases, which translated to additional load in CI/CD. As additional features were released, automated tests were written to support new features.
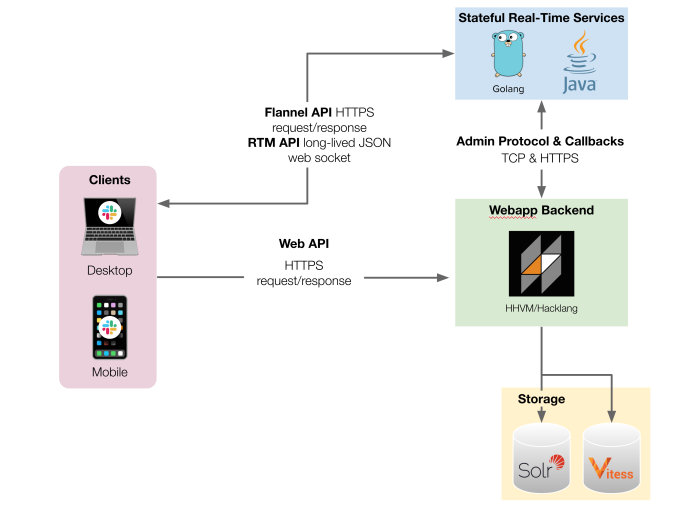
Figure 1. Simplified diagram of Slack’s Webapp architecture. Clients connect to three different APIs in order to present what users see efficiently in real time.
These two growth vectors led to regular new peaks of load, which resulted in novel failure modes in individual services and then cascading failures (between internal services) and incidents. Each service evolves at different rates that don’t necessarily accommodate new peaks easily through horizontal or vertical scaling (examples below).
Slack engineers assembled in large-scale internal incidents to resolve these cascading failures. Despite the fact that they did not affect Slack’s customers, the incidents still took time away from other work, often involving multiple teams and lasting multiple days. While they were going on, developers at Slack experienced degraded or stopped CI test executions and limited availability for CD workflows.
- Slack engineers and CI tests / CD workflows encountered Git errors when peak daily test counts exceeded what our Git application could serve, causing an increase in jobs in Checkpoint (async job processing) for orchestrating tests. These delays led to build-up of queues in both Checkpoint and Jenkins for executing tests. Engineers continued to do development (with limited availability of tests) and increased these queues before the initial job could be processed.
- Git is a cornerstone of Slack’s CI and developer tools. Git scale problems are well documented with larger organizations that build abstractions (like Google’s Piper) or alternate source control (like Facebook with Mercurial). In 2019, Slack internal tools adopted Git LFS to deal with large files. During this time, the Git appliance was consistently scaled up vertically. Developer growth against a large repo in Git has been a challenge that can be solved with custom source control systems like Piper or Github’s monorepo maintenance.
- Checkpoint has an internal asynchronous job queue (using self-hosted main-main MySQL and now, using AWS’s RDS Aurora) to keep state for CI/CD orchestration. This job queue and scheduler retries failed requests. The scheduler limits concurrent jobs to reduce load and reduce failed requests on the database. This limited concurrency creates lag for users of CI/CD when there are too many jobs in a queue (like test request jobs), causing them to request the same job repeatedly which triggers a positive feedback loop and an even larger queue.
- Slack’s internal tooling engineers regularly increased the number of test executors and environments before this project to accommodate an increasing number of engineers. Without noticing the breaking point, the combination of scale and requests from tests (i.e. test executors) and Slack environments (i.e. code under test) led to more requests than the search cluster in CI could handle gracefully, which then introduced errors and, of course, even more increasing load.
Figure 2. Example of workflows that have the potential to cascade failures between CI services and tools.
Why complexity matters
Slack uses integration and end-to-end tests to verify correctness for complex workflows that overlap multiple services. While Slack started with a single service (Webapp), today’s Slack involves multiple services that support the user experience. Slack clients connect to three different APIs in order to present what users see in real time (see a simplified view of the architecture in Figure 1). We describe many of the Webapp’s testing challenges and how we changed developer workflows in 2021 to mitigate many challenges resulting from large numbers of end-to-end tests. Slack is a complex application with a number of configurations (e.g. team, enterprise, and cross enterprise messages). To test complex code paths, product and test engineers focused on writing expressive automated tests, which rely on a lot of moving parts (see Figure 2).
Circuit breakers
Software circuit breakers, a concept borrowed from systems engineering, detect faults in external systems and stop sending calls against the known faulty systems. Clients are the typical place to implement a circuit breaker. Since our CI/CD orchestration layer regulates the flow of requests through the system, our teams aligned on implementing circuit breaker clients, with multiple concurrent jobs calling the client, in the orchestrator consumer before sending requests to the next system. And of course, engineers and service owners need to be kept in the loop of the system changing behavior.
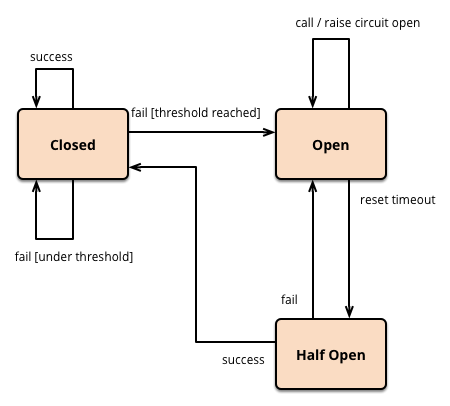
Figure 3. Circuit breaker control flow diagram.
We had a hypothesis that circuit breakers could minimize cascading failures and provide high leverage for programmatic metric queries for multiple services, instead of individual client- or service-based approaches. Unlike traditional circuit breakers in individual services, circuit breakers at the orchestration-level system could regulate the interface of requests between systems.
Circuit breakers opened when dependent services were encountering increased load or showing errors due to increased load. Checkpoint programmatically retrieved health metrics from multiple dependent services. Requests would then be deferred or dropped if downstream systems could not serve those requests. Circuit breakers would then close when the dependent service showed recovery, and those deferred requests would start executing once again. This management of known-faulty requests reduced cascading failure incidents that affected our company’s ability to build, test, deploy and release code as well as reduced flaky executions in CI.
Methodology
We started with an abstract class, implemented in Hacklang, to ground discussions and prototype this new workflow. Our discussions focused on Checkpoint—the orchestration service—instead of build or test clients. Checkpoint orchestrates CI/CD workflows and its background job system represents the lifeblood of builds, tests, deployments, and releases at Slack. Checkpoint has an API endpoint that receives a GitHub webhook when a new commit is created. From this single commit, Checkpoint enqueues multiple background jobs that trigger Jenkins asset builds or tests and then updates test results in the database.
We chose to focus on circuit breaking with deferral and load shedding in Checkpoint background jobs. While circuit breakers can live in client logic (e.g. to wait for recovery or block to hold work), Checkpoint’s background job system presented a unique opportunity because it’s the intermediary between multiple systems through the scheduler.
- We use Trickster to perform programmatic look-ups for dependent service metrics in several Prometheus clusters using PromQL. This service is a frontend, proxy, and cache for queries to multiple Prometheus clusters.
- Checkpoint didn’t need a half-open state due to internal background job retries and use of deferred CI requests. Half-open states are important for individual client requests to trickle through and to indicate recovery for these clients. Since Checkpoint’s background job system has retries and this circuit breaker contains a TTL on the Prometheus query, Checkpoint readily resumes work once an open circuit breaker recovers.
namespace Checkpoint\CircuitBreaker;
use type Slack\Checkpoint\PromClient;

/*
* Generic interface for Circuit Breakers in Checkpoint.
* Downstream actions include deferral mechanisms or load shedding.
* @see https://martinfowler.com/bliki/CircuitBreaker.html
*/

enum CircuitBreakerState: string {
  CLOSED = 'closed';
  OPEN = 'open';
}

abstract class CircuitBreaker {

  /**
   * Get the state of this circuit breaker. Note the return value is intentionally
   * not a `Result<CircuitBreakerState>`. In the case of internal errors, this must
   * decide if the breaker fails open/closed.
   */
  abstract protected function getState(): CircuitBreakerState;

  /**
   * Allow for bypassing a circuit breaker. Used as a circuit breaker for circuit breakers.
   * In a subsequent class, add the following to always allow the request to pass through
   * <<__Override, __Memoize>>
   * public function bypass(): bool { return true; }
   */
  public function bypass(): bool {
    return false;
  }

  public function allowRequest(): bool {
    $state = $this->getState();
    PromClient::circuit_breaker_requests()->inc(1, darray[
      'breaker_type' => (string)static::class,
      'breaker_state' => (string)$state,
    ]);
    if ($this->bypass()) return true;
    return $state === CircuitBreakerState::CLOSED;
  }
}
Figure 4. Simplified code for the CircuitBreaker class.
Multiple implementations
In the first implementation sprint, we focused on circuit breakers for orchestration service health:
- Defer test jobs when Checkpoint and Jenkins queues reach a certain threshold.
- Defer test jobs on end-to-end test jobs when all Slack test environments are busy.
- Load shed test executions for older commits on a branch.
- Load shed test retries for any suite that has had consistent failures.
In the next implementation sprint, we focused on circuit breakers for shared dependent services:
- Flannel – an edge cache in multiple regions worldwide that returns frequently fetched teamwide data.
- Vitess – the source of truth for all customer data (with MySQL syntax). Vitess is a database solution for deploying, scaling, and managing large clusters of database instances.
- Search – a service providing indices of messages, files and people that computes a live collection (fed real-time through the job queue) and weekly collection (computed offline with information from the beginning of time).
A simplified implementation is shared in the figure below for Flannel. You’ll notice a lookup in cache (along with TTL), a Prometheus range query, user messaging, and calls to Trickster using that Prometheus range query. Safety is important here—if Trickster / Prometheus clusters return an error we keep the circuit breaker closed to allow for requests to flow through. Similarly, we cache responses for consistent client requests between asynchronous jobs.
namespace Checkpoint\CIBot\CircuitBreaker;

use namespace Checkpoint\{CIIssue, Trickster};

use type Checkpoint\CIBot\Delta\{DeltaAnomalyType, DeltaDimensionType};
use type Checkpoint\CIIssue\ServiceDepCircuitBreakerType;
use type Checkpoint\CircuitBreaker\{Cacheable, CircuitBreaker, CircuitBreakerState};
use type Slack\Checkpoint\PromClient;

type flannel_callback_error_rate_cache_t = shape(
	'ts' => int,
	'error_rate' => int,
);

final class FlannelServiceDepCircuitBreaker extends CircuitBreaker {
   use Cacheable;

   const int TTL = 60; // Time-to-Live for cached value
   const int FLANNEL_CALLBACK_ERROR_RATE_THRESHOLD = 5;
   const string PROM_FLANNEL_CLUSTER = 'flannel';
   const string PROM_FLANNEL_QUERY_GLOBAL = 'sum(dc:cb_errors:irate1m{error!~"org_login_required"})';
   const string ISSUE_MESSAGE_OPEN = ':warning: :broken_yellow_heart:  Flannel Circuit Breaker is open. Tests are deferred';
   const string ISSUE_MESSAGE_CLOSE = 'This circuit breaker is closed. Tests are starting again';
   const string ISSUE_KEY = ServiceDepCircuitBreakerType::FLANNEL;

   public function __construct(private ?\github_repos_t $repo = null, private ?\TSlackjsonValidatorPropertiesCheckpointPropertiesTestsItems $test = null) {}

   <<__Override, __Memoize>>
   public function getState(): CircuitBreakerState {

       $cached_key = $this->getCacheKey(self::class, 'flannel_callback_errors');
       $cached_data = \cache_get($cached_key);
       $existing_error_rate = 0;

       // If the cache exists, and is fresh enough, use it. Default to Closed
       $result = \type_assert_type($cached_data, flannel_callback_error_rate_cache_t::class);
       if ($result->is_error()) { return CircuitBreakerState::CLOSED; }

       $data = $result->get();
       $existing_error_rate = $data['error_rate'];
       if ($this->isValidCache($data['ts'], static::TTL)) {
           if ($existing_error_rate < static::FLANNEL_CALLBACK_ERROR_RATE_THRESHOLD) {
               return CircuitBreakerState::CLOSED;
           } else {
               return CircuitBreakerState::OPEN;
           }
       }
       // Lets fetch the current error rate (and compare against the former one)
       $result = $this->getFlannelCallbackErrorRate();
       if ($result->is_error()) {
           return CircuitBreakerState::CLOSED;
       }

       $error_rate = $result->get();
       $cached_value = shape('ts' => \time(), 'error_rate' => $error_rate);
       \cache_set($cached_key, $cached_value);

       if ($error_rate >= static::FLANNEL_CALLBACK_ERROR_RATE_THRESHOLD) {
           PromClient::cibot_service_dependency_error_rate_above_threshold()->inc(1, darray[
               'breaker_type' => (string)static::class,
           ]);

           if ($existing_error_rate < static::FLANNEL_CALLBACK_ERROR_RATE_THRESHOLD) {
               CIIssue\send(static::ISSUE_MESSAGE_OPEN, DeltaDimensionType::CIRCUIT_BREAKER, DeltaAnomalyType::CIRCUIT_BREAKER_OPEN, static::ISSUE_KEY);
           }

           return CircuitBreakerState::OPEN;
       }

       // If our circuit breaker was previously open (and now closed), track this new state and mark it in our issues dataset
       if ($existing_error_rate >= static::FLANNEL_CALLBACK_ERROR_RATE_THRESHOLD) {
           CIIssue\end(static::ISSUE_MESSAGE_CLOSE, DeltaDimensionType::CIRCUIT_BREAKER, DeltaAnomalyType::CIRCUIT_BREAKER_OPEN, static::ISSUE_KEY);
       }
       return CircuitBreakerState::CLOSED;
   }
Figure 5. Simplified code for the FlannelServiceDepCircuitBreaker class.
User interaction
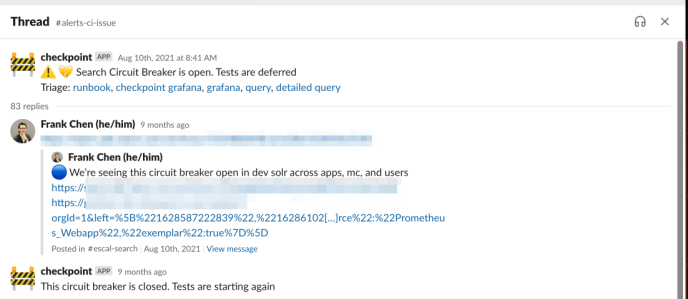
Each of these circuit breakers would fetch data and alert a channel when it detected an issue. The circuit breaker opening would show a few different views of the same issue. A typical workflow might involve a member of our team noticing the circuit breaker open, then escalating to the corresponding team channel with the details.
Figure 6. Screenshot of an automated circuit breaker message in #alerts-ci-issue leading to escalation with the search team for a spike in error rate.
In this automated circuit breaker message, each link shows different views of the same issue. Similar deferred messages are shown for the Checkpoint frontend.
Figure 7. Screenshot of an automated circuit breaker message showing a service issue and test status (“Jenkins queue is currently high, Tests will continue when the queue goes down”) in Checkpoint’s PR / test view.
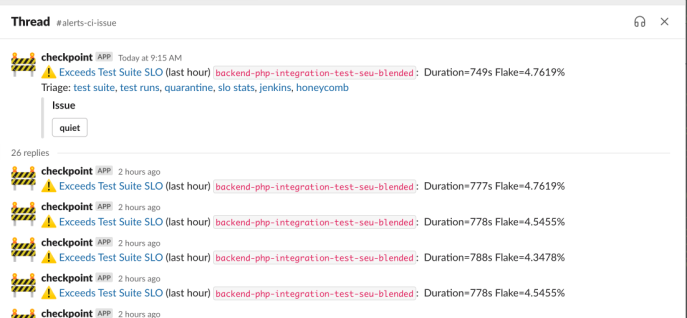
We mentioned earlier that Checkpoint makes queries for different service error rates, and we created a small internal library to report open circuit breakers to Slack. Measuring these specific issues (instead of seeing undifferentiated spikes of errors) enhanced our ability to reason about open circuit breakers over time. Furthermore, we extended this issue library for anomaly detection (e.g. higher than expected failure, error rate, durations, or flakiness rates) across test executors, test environments, and test suites. These in turn feed into a smoother developer experience.
Figure 8. Screenshot of anomaly detection for test suite execution.
Developer impact
Since two sets of infrastructure and dependent service breakers were introduced, we have reduced the surface area for cascading failures (by test deferral) and smoothed out the throughput for test executions (by load shedding).
The result has been a significantly improved developer experience—zero cascading failure incidents in internal tooling over the last two years—and significantly reduced load for critical services that benefited the CI/CD user experience.
Those incidents were common before the two periods of implementation in 2020. We regularly encounter new peak loads by programmatically looking up dependent service load in CI orchestration. During a recent Git LFS incident, while the symptoms were similar to earlier incidents, the situation was localized to test executors and teams were able to fix and isolate the failures without cascading failures.
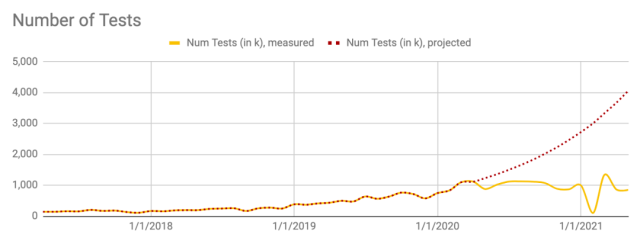
Better feedback loops. Engineers now get feedback from Checkpoint’s frontend and via Slack when their tests are deferred until the system recovers. Before circuit breakers, these tests would flake or fail due to some downstream system being overloaded. Deferring tests overall led to fewer flakes and test executions that were less relevant. Below is an illustration from an earlier blog post showing the drastic change in test requests that are no longer relevant to engineers who originally submitted them (e.g. a newer commit) and deferral of valid test requests that would have required multiple tests to resolve flakes. Note the two curve changes after each implementation period (March 2020 and August 2020).
Figure 9. A projection (in red) of executed test suites based on 10% growth, and curve change (in yellow) from loading shed + deferred jobs and pipeline changes.
As a side benefit, our team was able to recalibrate spend and provisioning for a portion of the fleet dedicated to running tests against commit SHAs that were not the tip of the developer branch. For details on a cumulative 10x decrease in spend compared to baseline growth, read our blog post on infrastructure observability.
Finally, to understand feedback loops on tests, teams working across CI had aligned a business metric “time to test results.” This metric looks at the lag for developers to get results from builds and tests executing in CI. Teammates expressed concern that adding circuit breakers to defer or to shed load felt counterintuitive to sending results back quickly. Instead of seeing this metric go in the wrong direction (be slower), this metric has been steady over the last years, since many of those same tests would have failed and then presented flaky results to customers.
Aside: How to frame this solution for your organization?
Every organization has a unique composition of CI/CD culture, tooling, and infrastructure. While this solution can’t be copy-pasted in your organization, you can borrow ideas for separating concerns using orchestration-layer circuit breakers.
How did our organization decide on using circuit breakers for CI/CD? We focus on Webapp as its the main repository where business logic lives for Slack’s customers and most developers spend most of their time.
Test environments are complex—unit and integration tests can mean different things across organizations. For example, unit and integration tests might have mocked environments and payload requests at one organization while another might rely on shared environments.
For Slack, many of the Webapp tests rely upon both synchronous and asynchronous requests (e.g. background jobs or websocket connections). A test for posting a message might first hit an API endpoint that then enqueues multiple asynchronous jobs to send notifications to other clients, enqueue this message for search, etc. Today, we have defined a testing taxonomy to align with Google’s small / medium / large taxonomy and emphasized shifting from an hourglass figure of mostly end-to-end and unit tests toward more medium (integration) tests to verify safety.
How might your organization use this pattern for CI/CD? You have a number of choices of CI/CD orchestration platforms like Gitlab, ArgoCD, GitHub Actions, or Jenkins and you can refer to the design decisions we shared in the Methodology section.
In choosing the right lever, we recommend using metrics, events, logs, or traces to drill down into areas of concern or common problems in the pipeline. Our approach was to initially share awareness of an open circuit breaker (see Figure 5 of a service displaying a high error rate) to Slack before opening the circuit and deferring or shedding requests. This allowed us to gain confidence on the problem space as we iteratively shipped circuit breakers in the orchestration platform.
Since Slack’s service layout for Webapp follows a generally complex layout, product and testing followed that pattern to create tests that flowed from this layout. Today, Slack engineers are also actively working toward a continuous deployment process. For years, Slack relied on a thin set of tests during the continuous delivery process. Building out an automated deployment and release testing process takes alignment due to the large number of moving pieces (e.g. when an automated rollback is requested and a fault is detected mid-stream).
To summarize where we’re going—we are working toward more medium-sized tests and continuous deployments, as well as automated rollbacks later in the pipeline, to help make Slack engineers more productive.
Conclusion
This article shares the decision points and outcomes of orchestration-level circuit breakers for Checkpoint, Slack’s internal CI/CD orchestration system.
Before this project, engineers at Slack saw challenges as requests in internal tooling reached new peaks and a system may fail and could cascade failures into other systems. These circuit breakers on the interface between systems in CI minimized cascading failures and provided high leverage for programmatic metric queries for multiple services instead of individual client or service based approaches.
Since the project was completed in 2020, engineers no longer encounter cascading failures between systems in internal tooling. Engineers also saw increased service availability, overall throughput from Checkpoint and fewer bad developer experiences like flakiness from failing services. The result of circuit breakers is a substantive impact on the productivity of engineers throughout Slack.
Multiple teams are now looking to use this framework of programmatic metric queries to move Slack toward continuous deployments—by automating builds, tests, deploys, releases, and rollbacks.
Are these types of sociotechnical system challenges interesting for you? If so, join us! Find out more in our careers page.
Acknowledgements
This work could not have happened without help across our organization. I want to say a special thank you to Kris Merrill, Nolan Caudill, Travis Crawford, Sylvestor George, Marcellino Ornelas, Hannah Bottalla, Karen Xu, Sara Bee, Carlos Valdez, Mark Carey, Tory Payne, Venkat Venkatanaranappa, Brian Ramos, John Gallagher for their technical leadership and execution on this series of projects.
This focus on resiliency engineering was inspired by an opportunity to learn with the Resiliency Learning Lab (Lund University), organized by Nora Jones, David Woods, John Allspaw, Richard Cook, and Laura Maguire. For further reading, check out this excellent set of resources on learning from incidents by Jeli.io.


